
2025 · Structural Equation Modeling: A Multidisciplinary Journal · 32(5), 753–765
Journal DOI: 10.1080/10705511.2025.2497088 Open access
Author’s introduction (LinkedIn)
Abstract
Generalized structured component analysis (GSCA) and partial least squares path modeling (PLSPM) are statistical methods for component-based structural equation modeling, where constructs are represented as components or weighted sums of observed variables. While both methods employ different approaches to testing an interaction effect between components, their comparative performance in this context has not been systematically investigated. To address this gap, we conducted a simulation study to evaluate their relative performance across various experimental conditions. The results indicate that GSCA’s approach consistently outperforms PLSPM’s in testing a component interaction effect under all examined conditions.
Version of record · Abstract source · CC BY-NC-ND 4.0
Figures 7 images
Select an image to view it at full size. Captions identify the source and version.
Figure 1
Caption & source
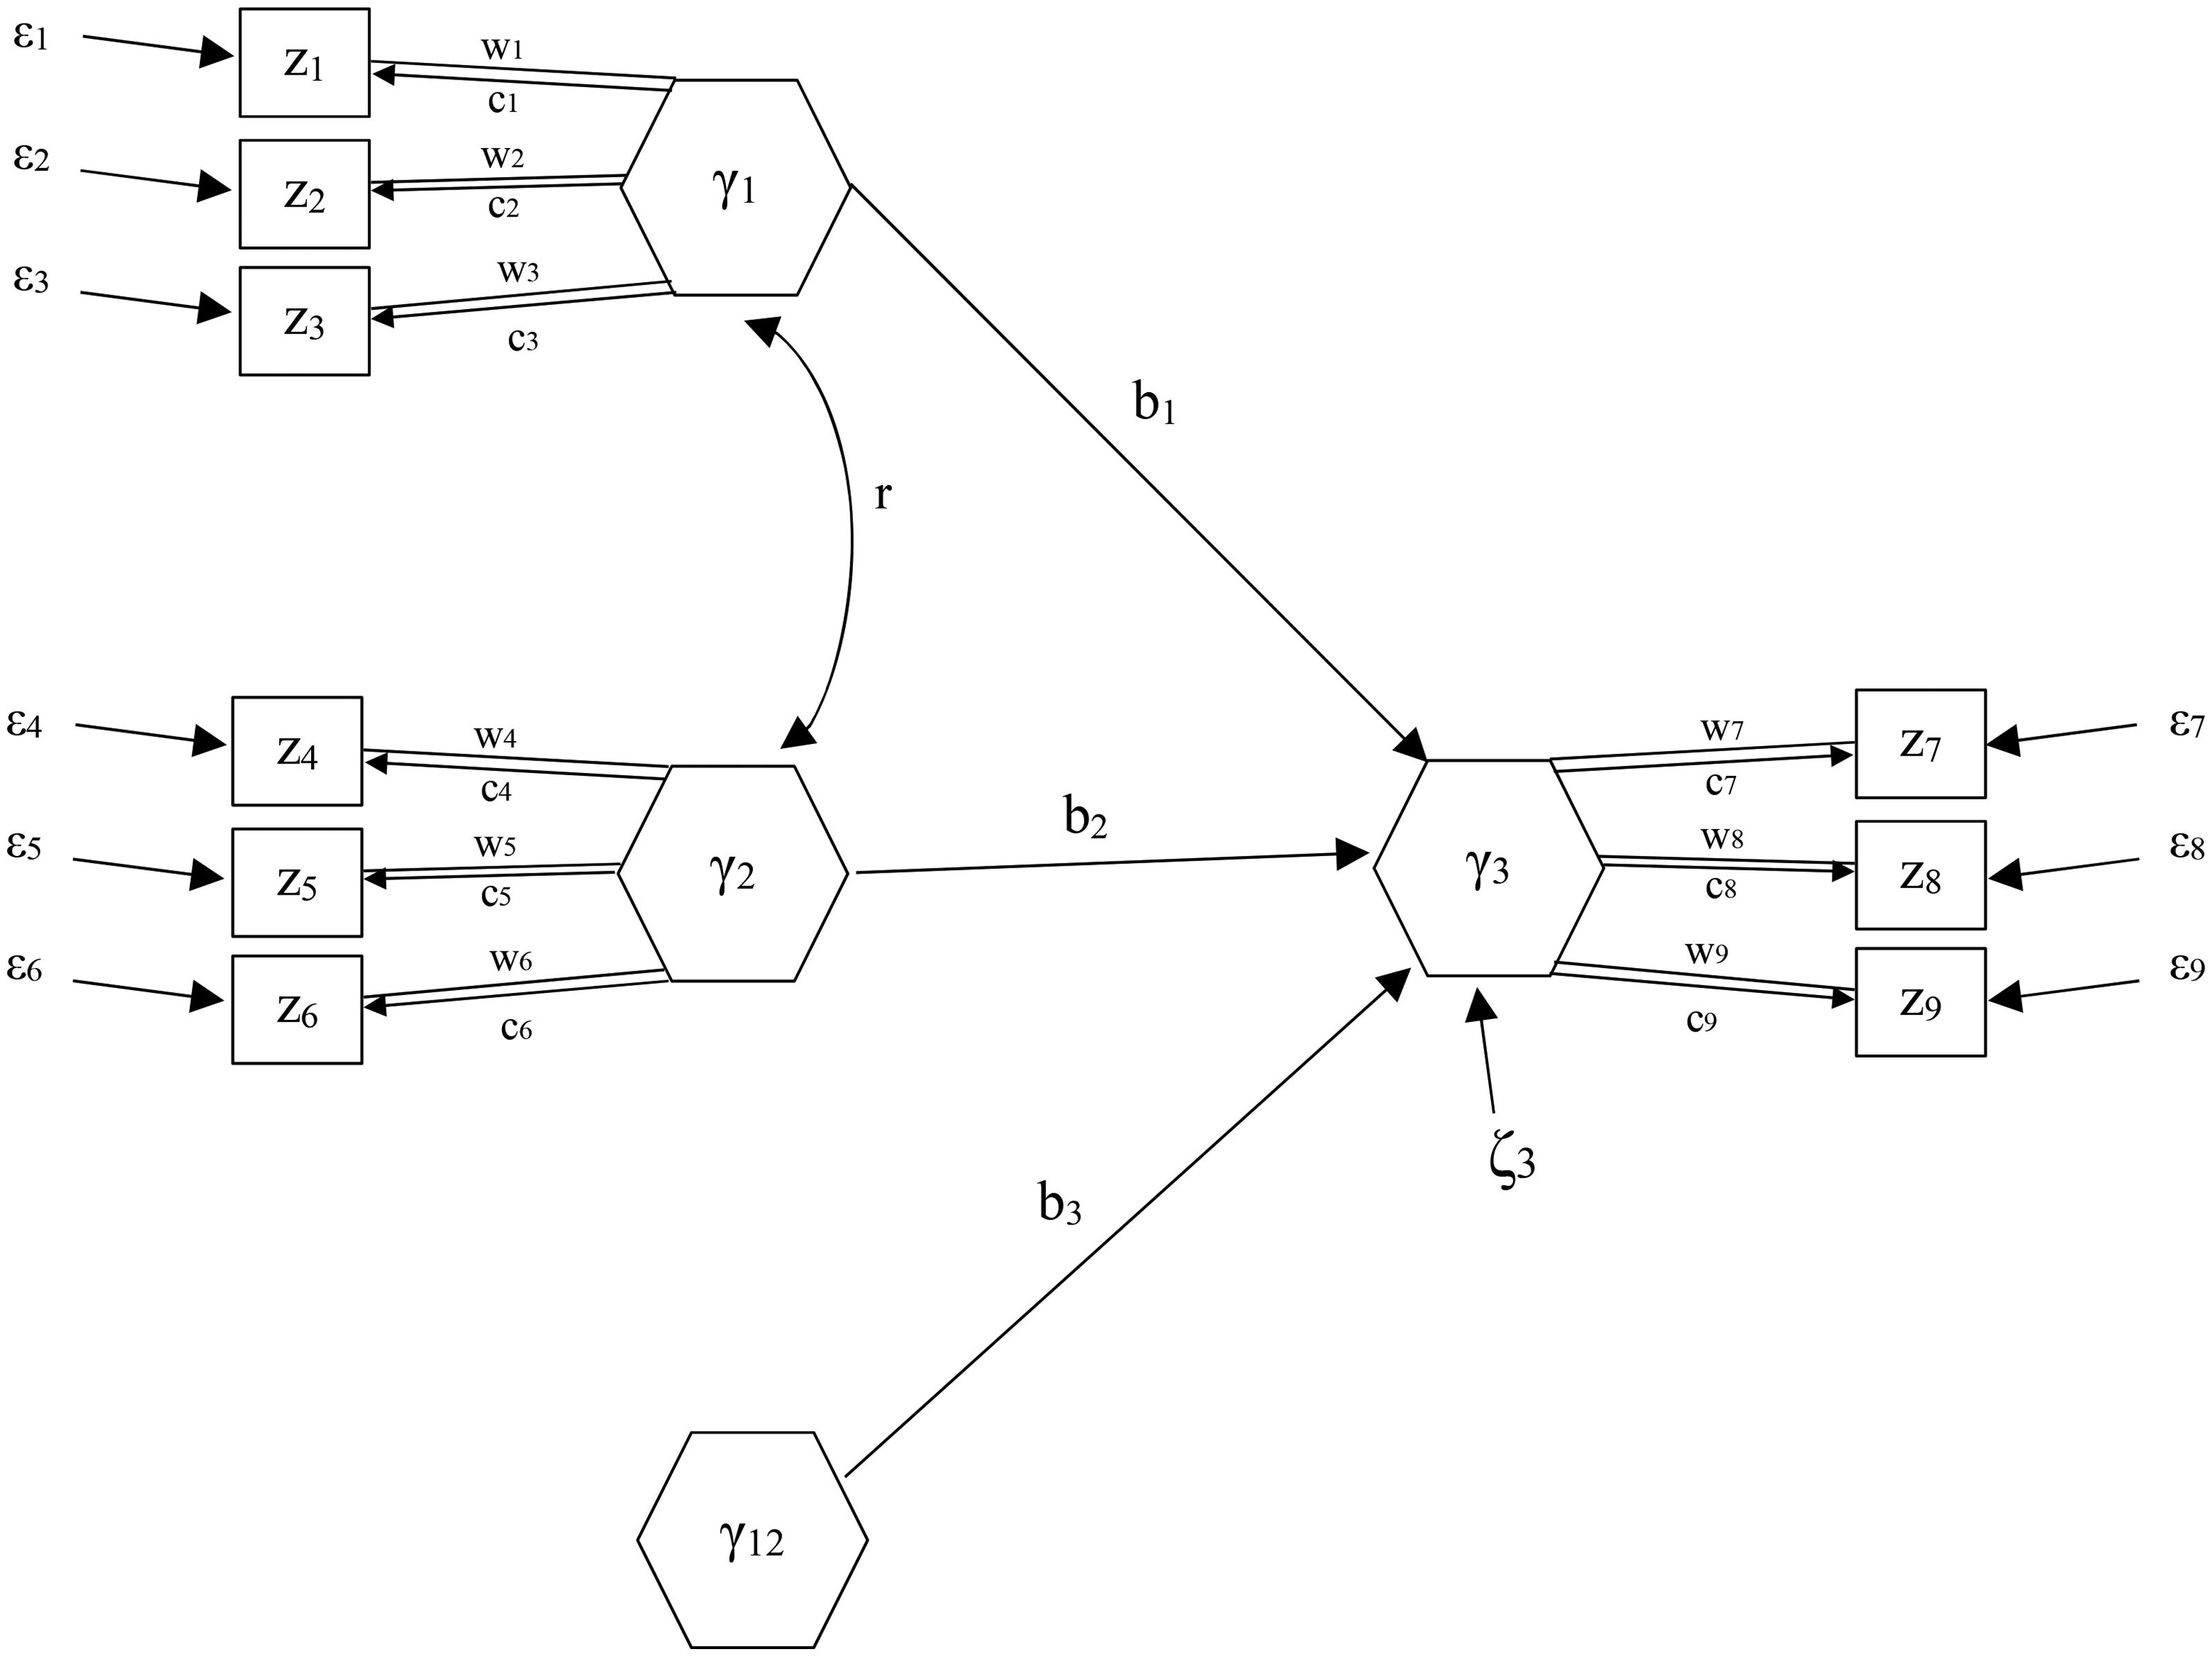
The population model considered in the simulation study.
Version of record · Figure source · CC BY-NC-ND 4.0
Shen, Cho, and Hwang (2025), Figure 1. Structural Equation Modeling: A Multidisciplinary Journal, 32(5), 753–765. https://doi.org/10.1080/10705511.2025.2497088. Reproduced without modification.
Figure 2
Caption & source
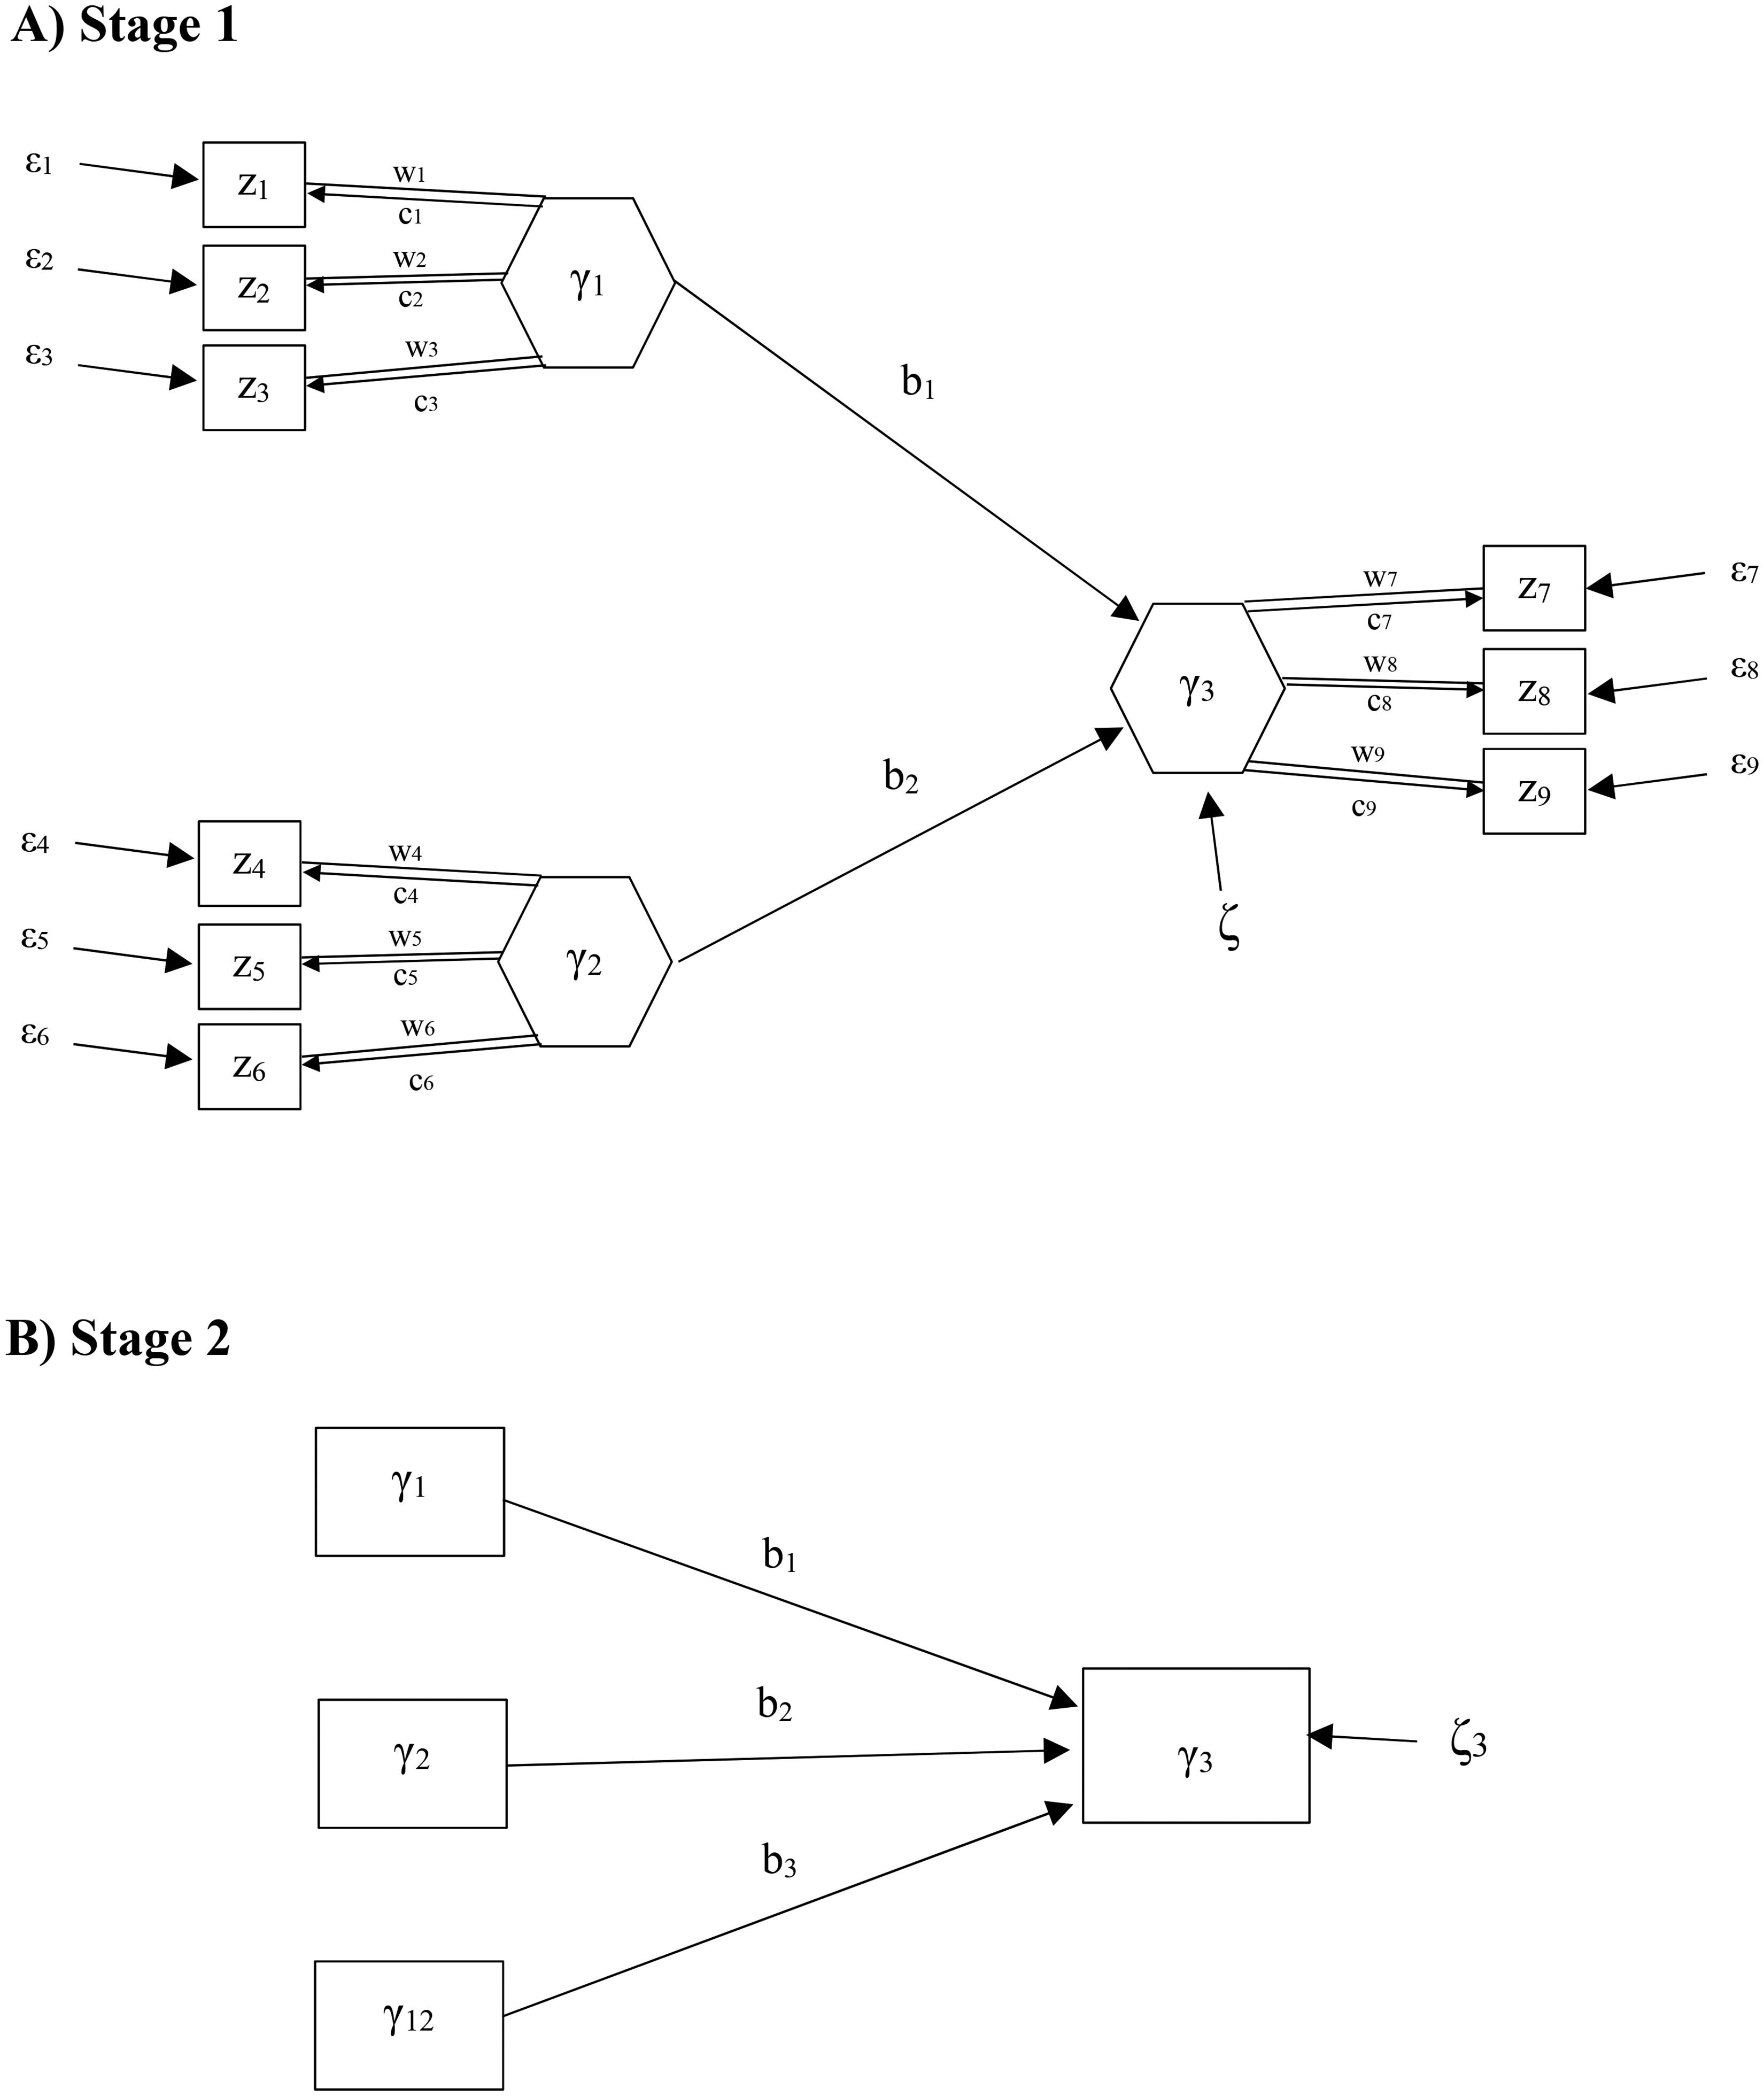
An illustration of PLSPM’s two-stage approach for the prototype model in Figure 1.
Version of record · Figure source · CC BY-NC-ND 4.0
Shen, Cho, and Hwang (2025), Figure 2. Structural Equation Modeling: A Multidisciplinary Journal, 32(5), 753–765. https://doi.org/10.1080/10705511.2025.2497088. Reproduced without modification.
Figure 3
Caption & source
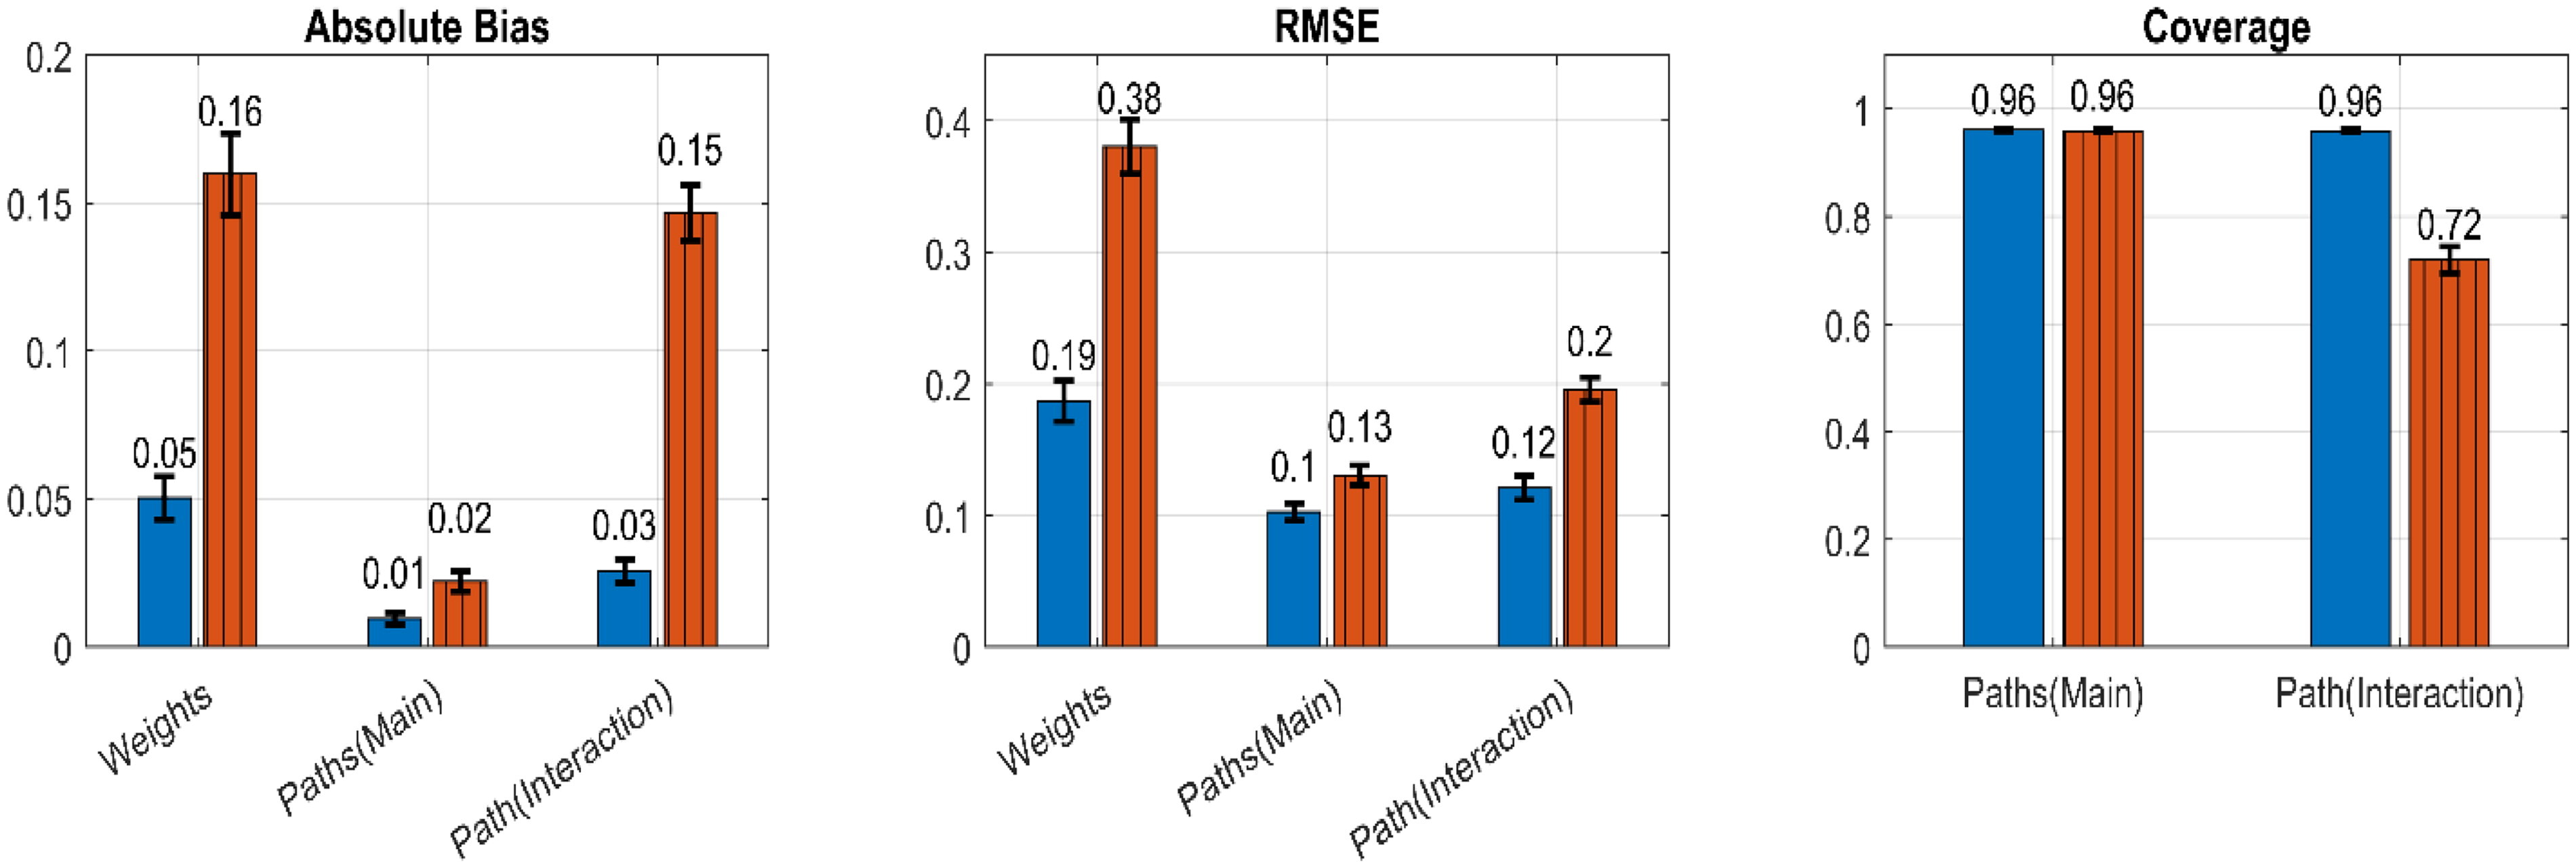
The average absolute bias, RMSE, and coverage rates of the estimates of the weights and main and interaction effects from GSCA’s and PLSPM’s approaches, aggregated over all the conditions. Blue solid and red vertical-line bars denote GSCA’s and PLSPM’s approaches, respectively. Error bars represent ± two standard errors from the aggregated metrics.
Version of record · Figure source · CC BY-NC-ND 4.0
Shen, Cho, and Hwang (2025), Figure 3. Structural Equation Modeling: A Multidisciplinary Journal, 32(5), 753–765. https://doi.org/10.1080/10705511.2025.2497088. Reproduced without modification.
Figure 4
Caption & source
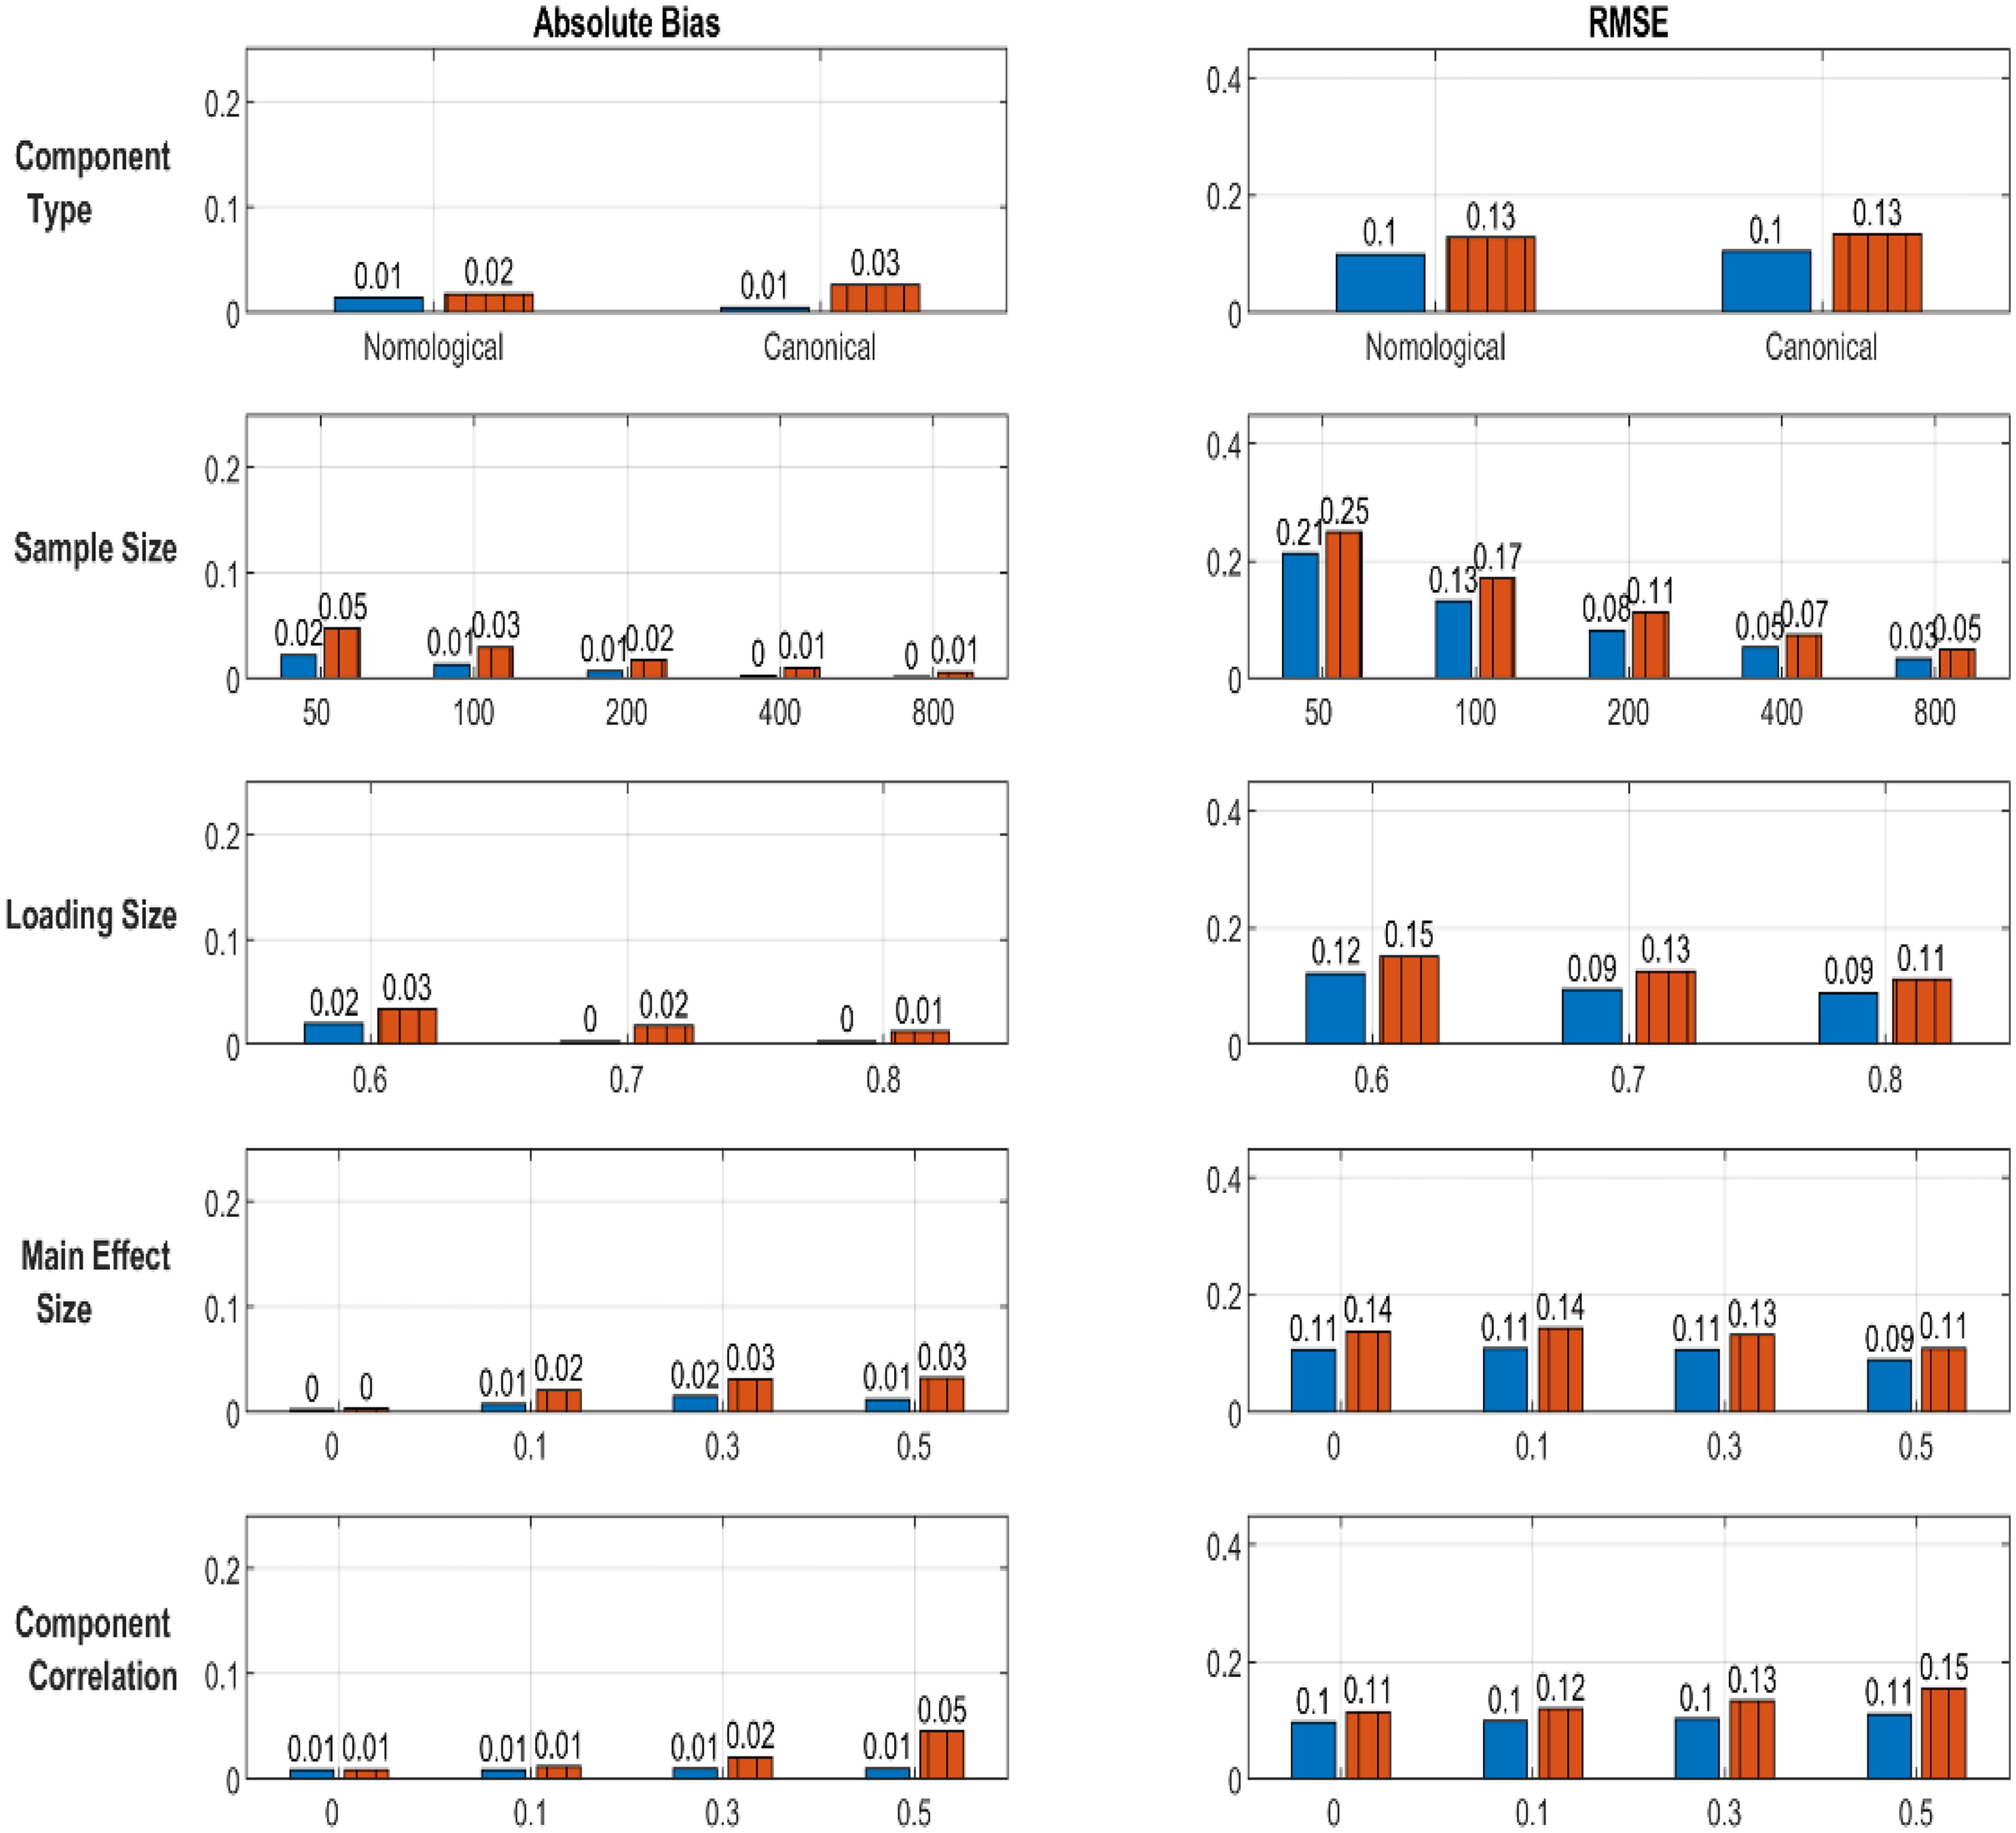
The average absolute bias and RMSE values of the main effect estimates from GSCA’s and PLSPM’s approaches in each condition. Blue solid and red vertical-line bars denote GSCA’s and PLSPM’s approaches, respectively.
Version of record · Figure source · CC BY-NC-ND 4.0
Shen, Cho, and Hwang (2025), Figure 4. Structural Equation Modeling: A Multidisciplinary Journal, 32(5), 753–765. https://doi.org/10.1080/10705511.2025.2497088. Reproduced without modification.
Figure 5
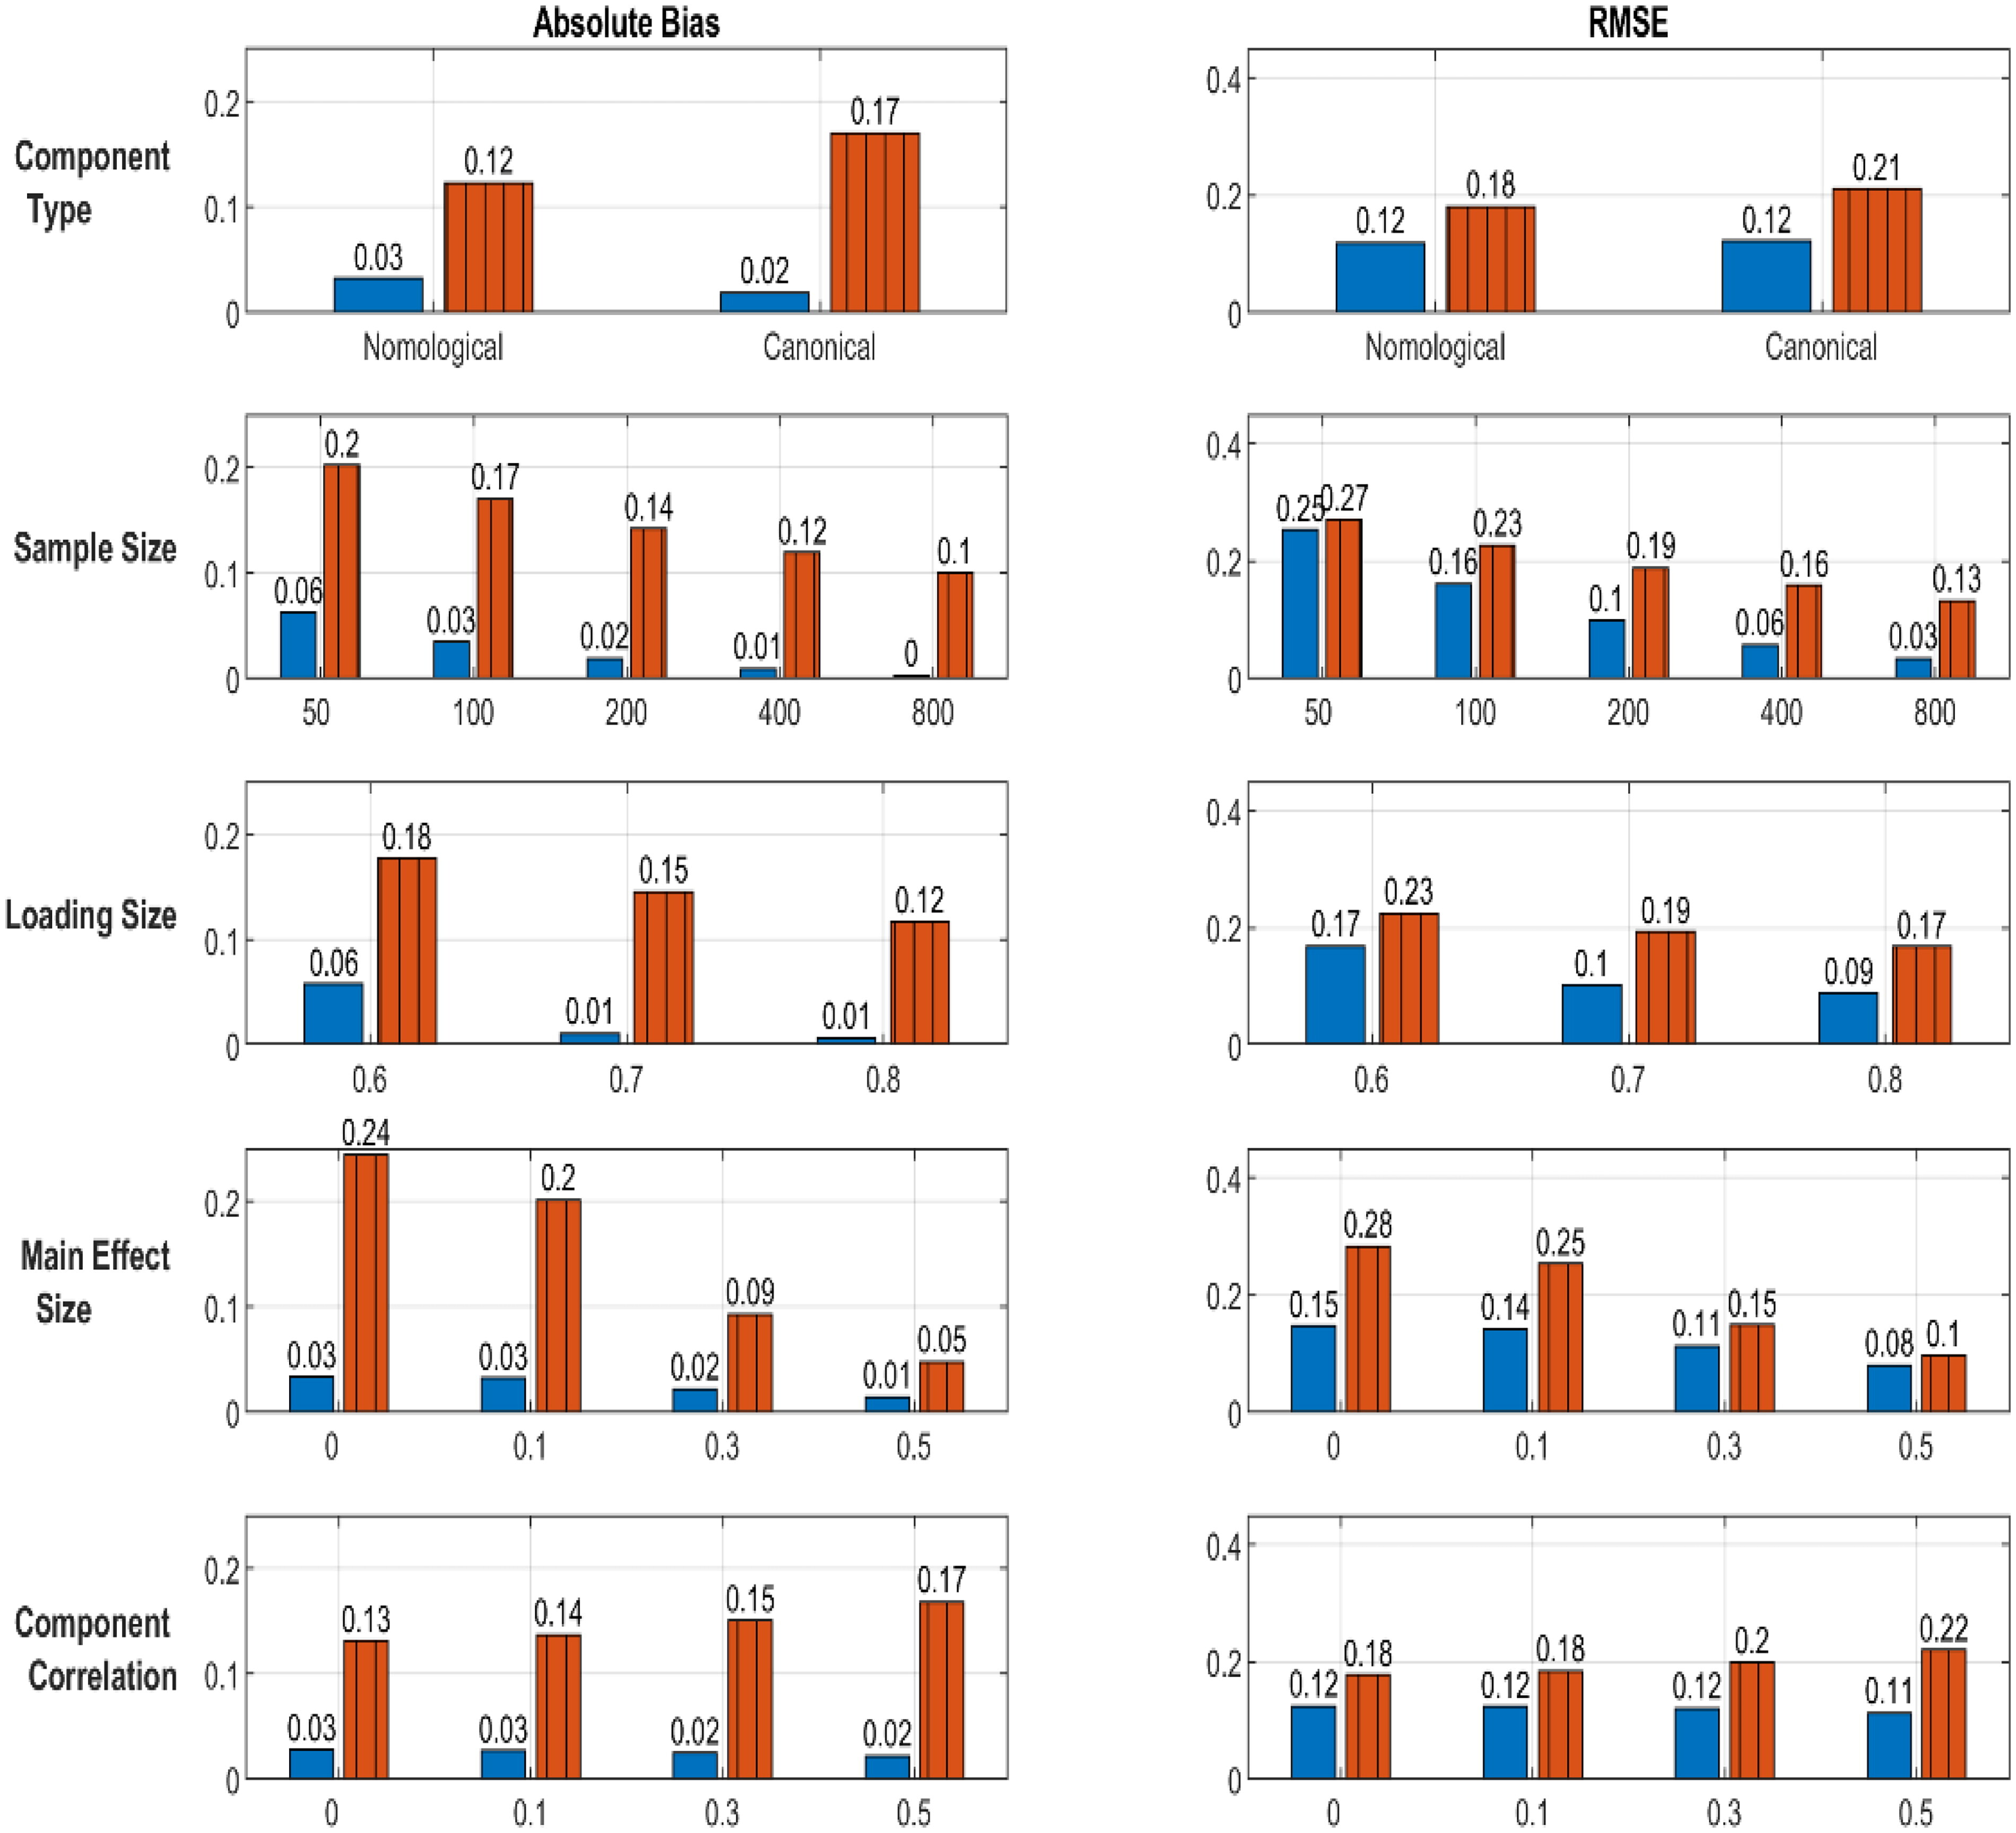
Caption & source
The average absolute bias and RMSE values of the interaction effect estimates from GSCA’s and PLSPM’s approaches in each condition. Blue solid and red vertical-line bars denote GSCA’s and PLSPM’s approaches, respectively.
Version of record · Figure source · CC BY-NC-ND 4.0
Shen, Cho, and Hwang (2025), Figure 5. Structural Equation Modeling: A Multidisciplinary Journal, 32(5), 753–765. https://doi.org/10.1080/10705511.2025.2497088. Reproduced without modification.
Figure 6
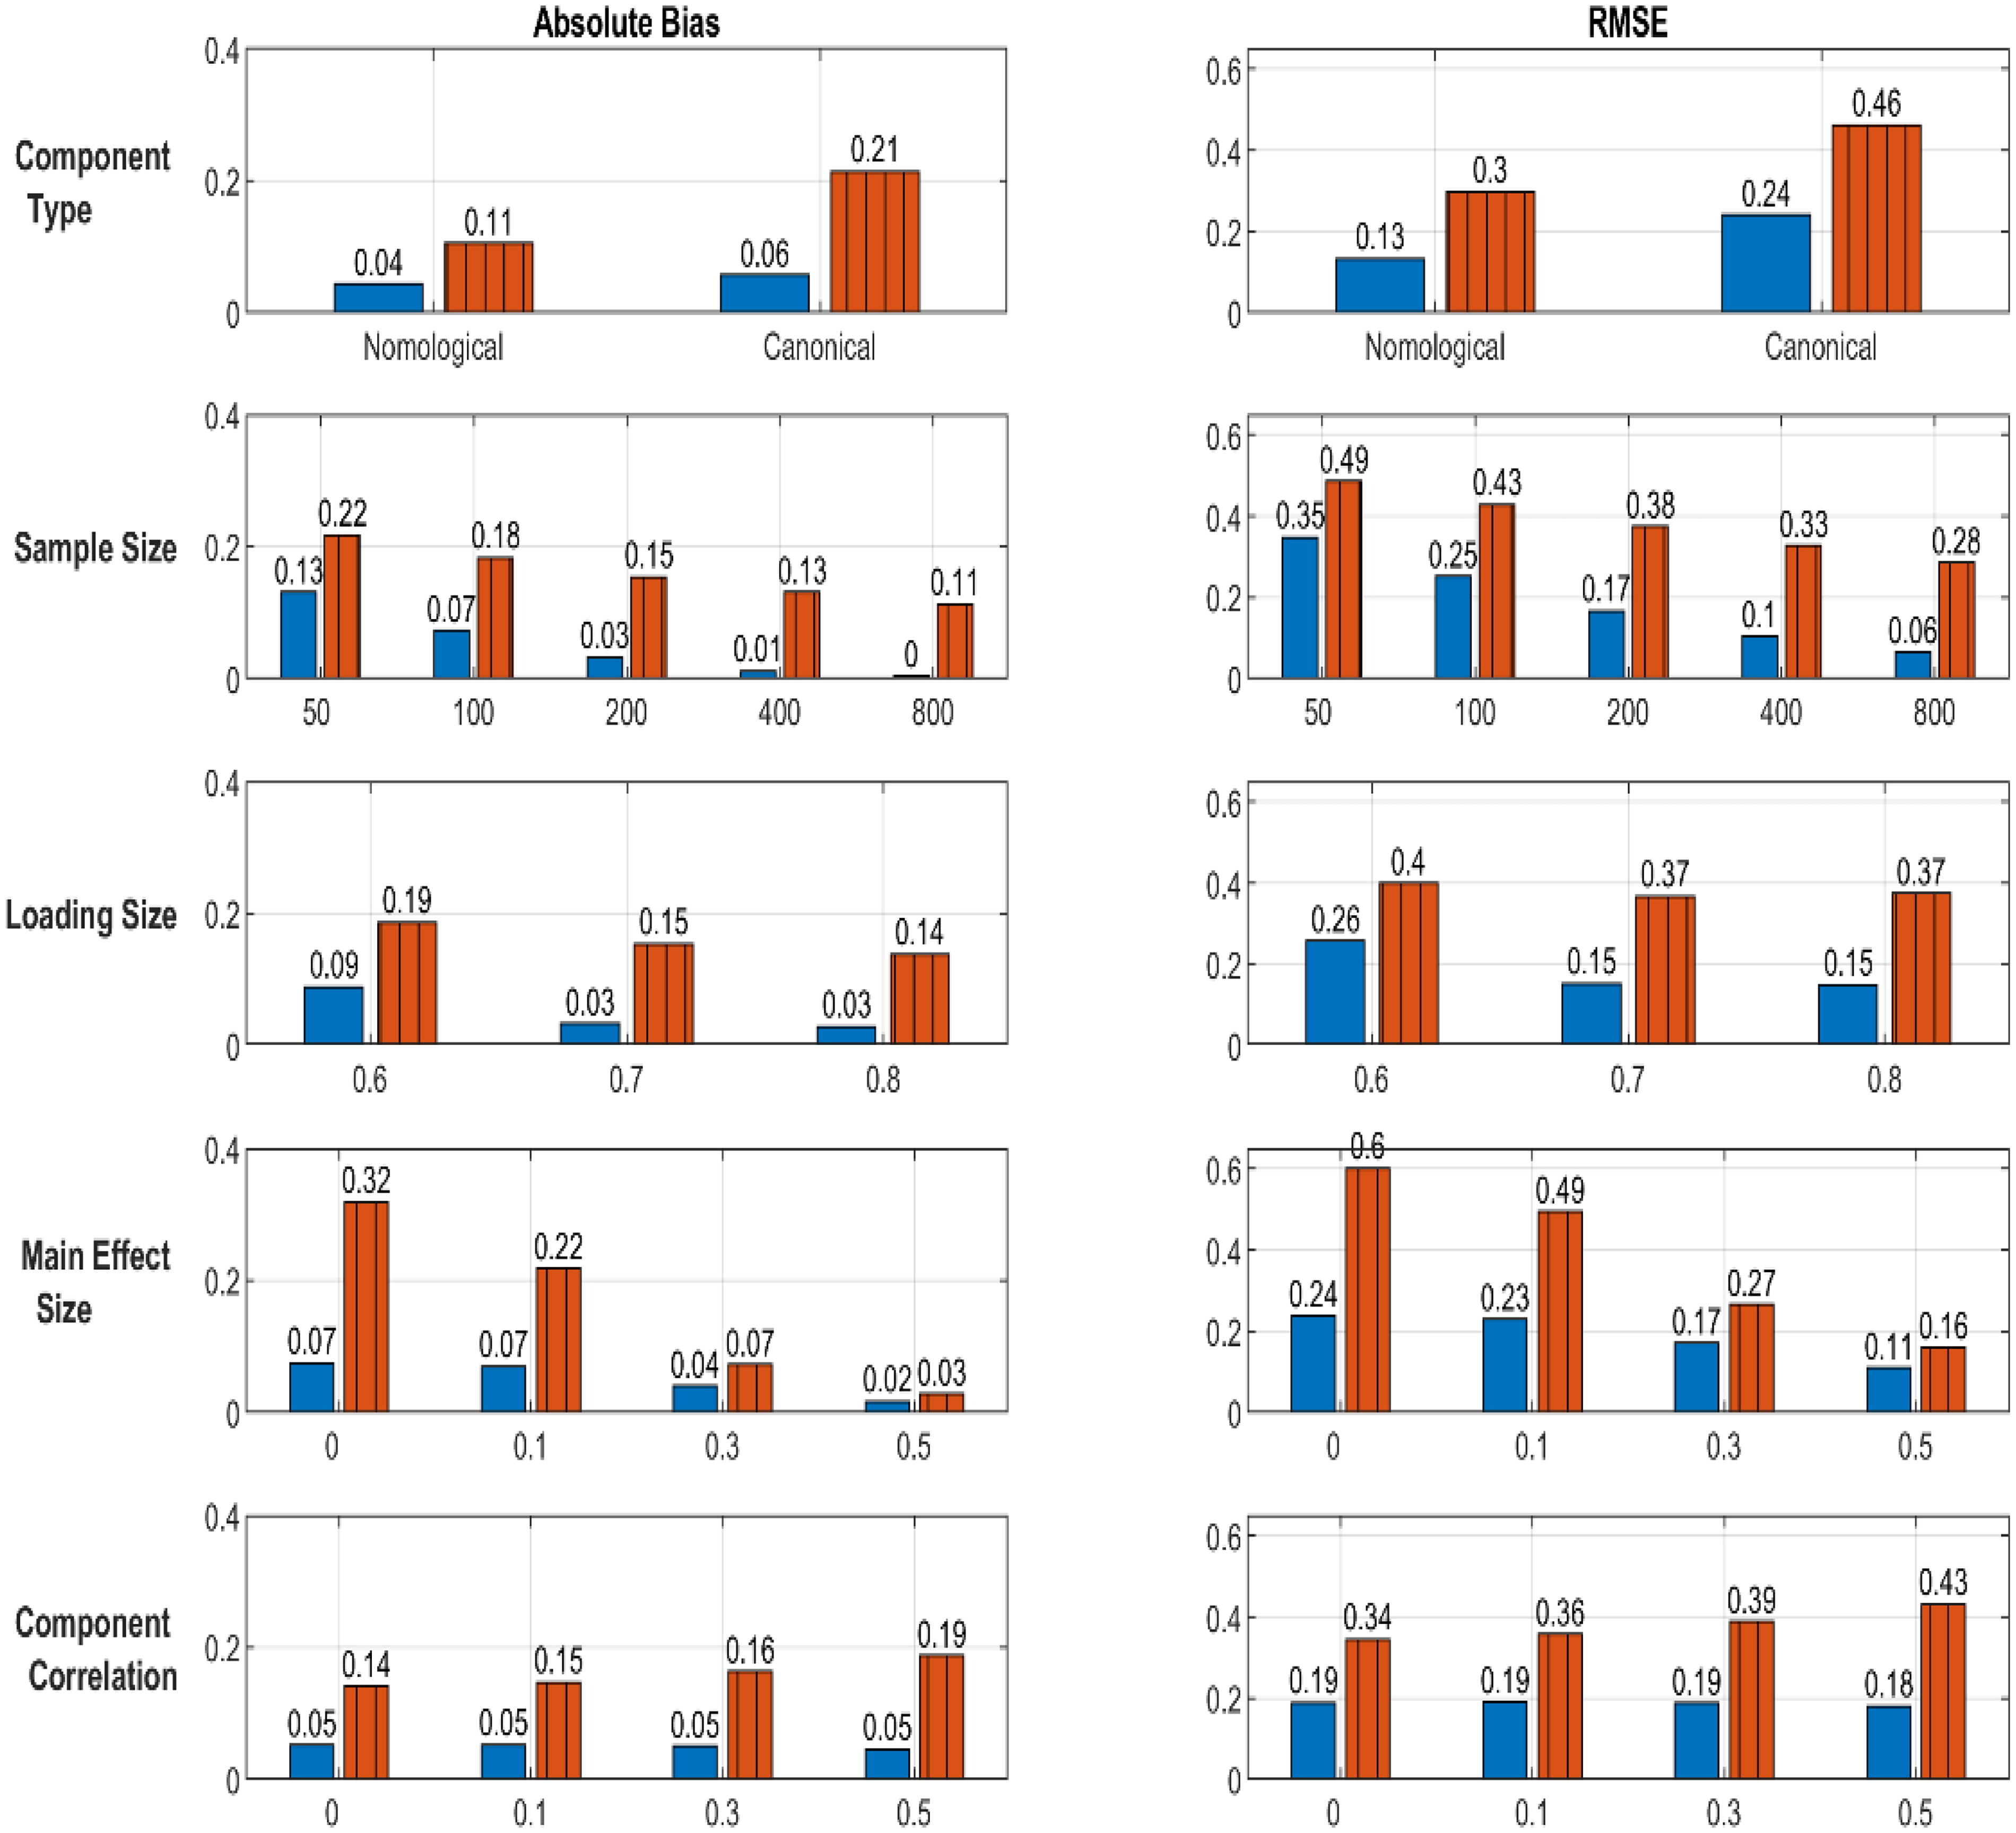
Caption & source
The average absolute bias and RMSE values of the weight estimates from GSCA’s and PLSPM’s approaches in each condition. Blue solid and red vertical-line bars denote GSCA’s and PLSPM’s approaches, respectively.
Version of record · Figure source · CC BY-NC-ND 4.0
Shen, Cho, and Hwang (2025), Figure 6. Structural Equation Modeling: A Multidisciplinary Journal, 32(5), 753–765. https://doi.org/10.1080/10705511.2025.2497088. Reproduced without modification.
Figure 7
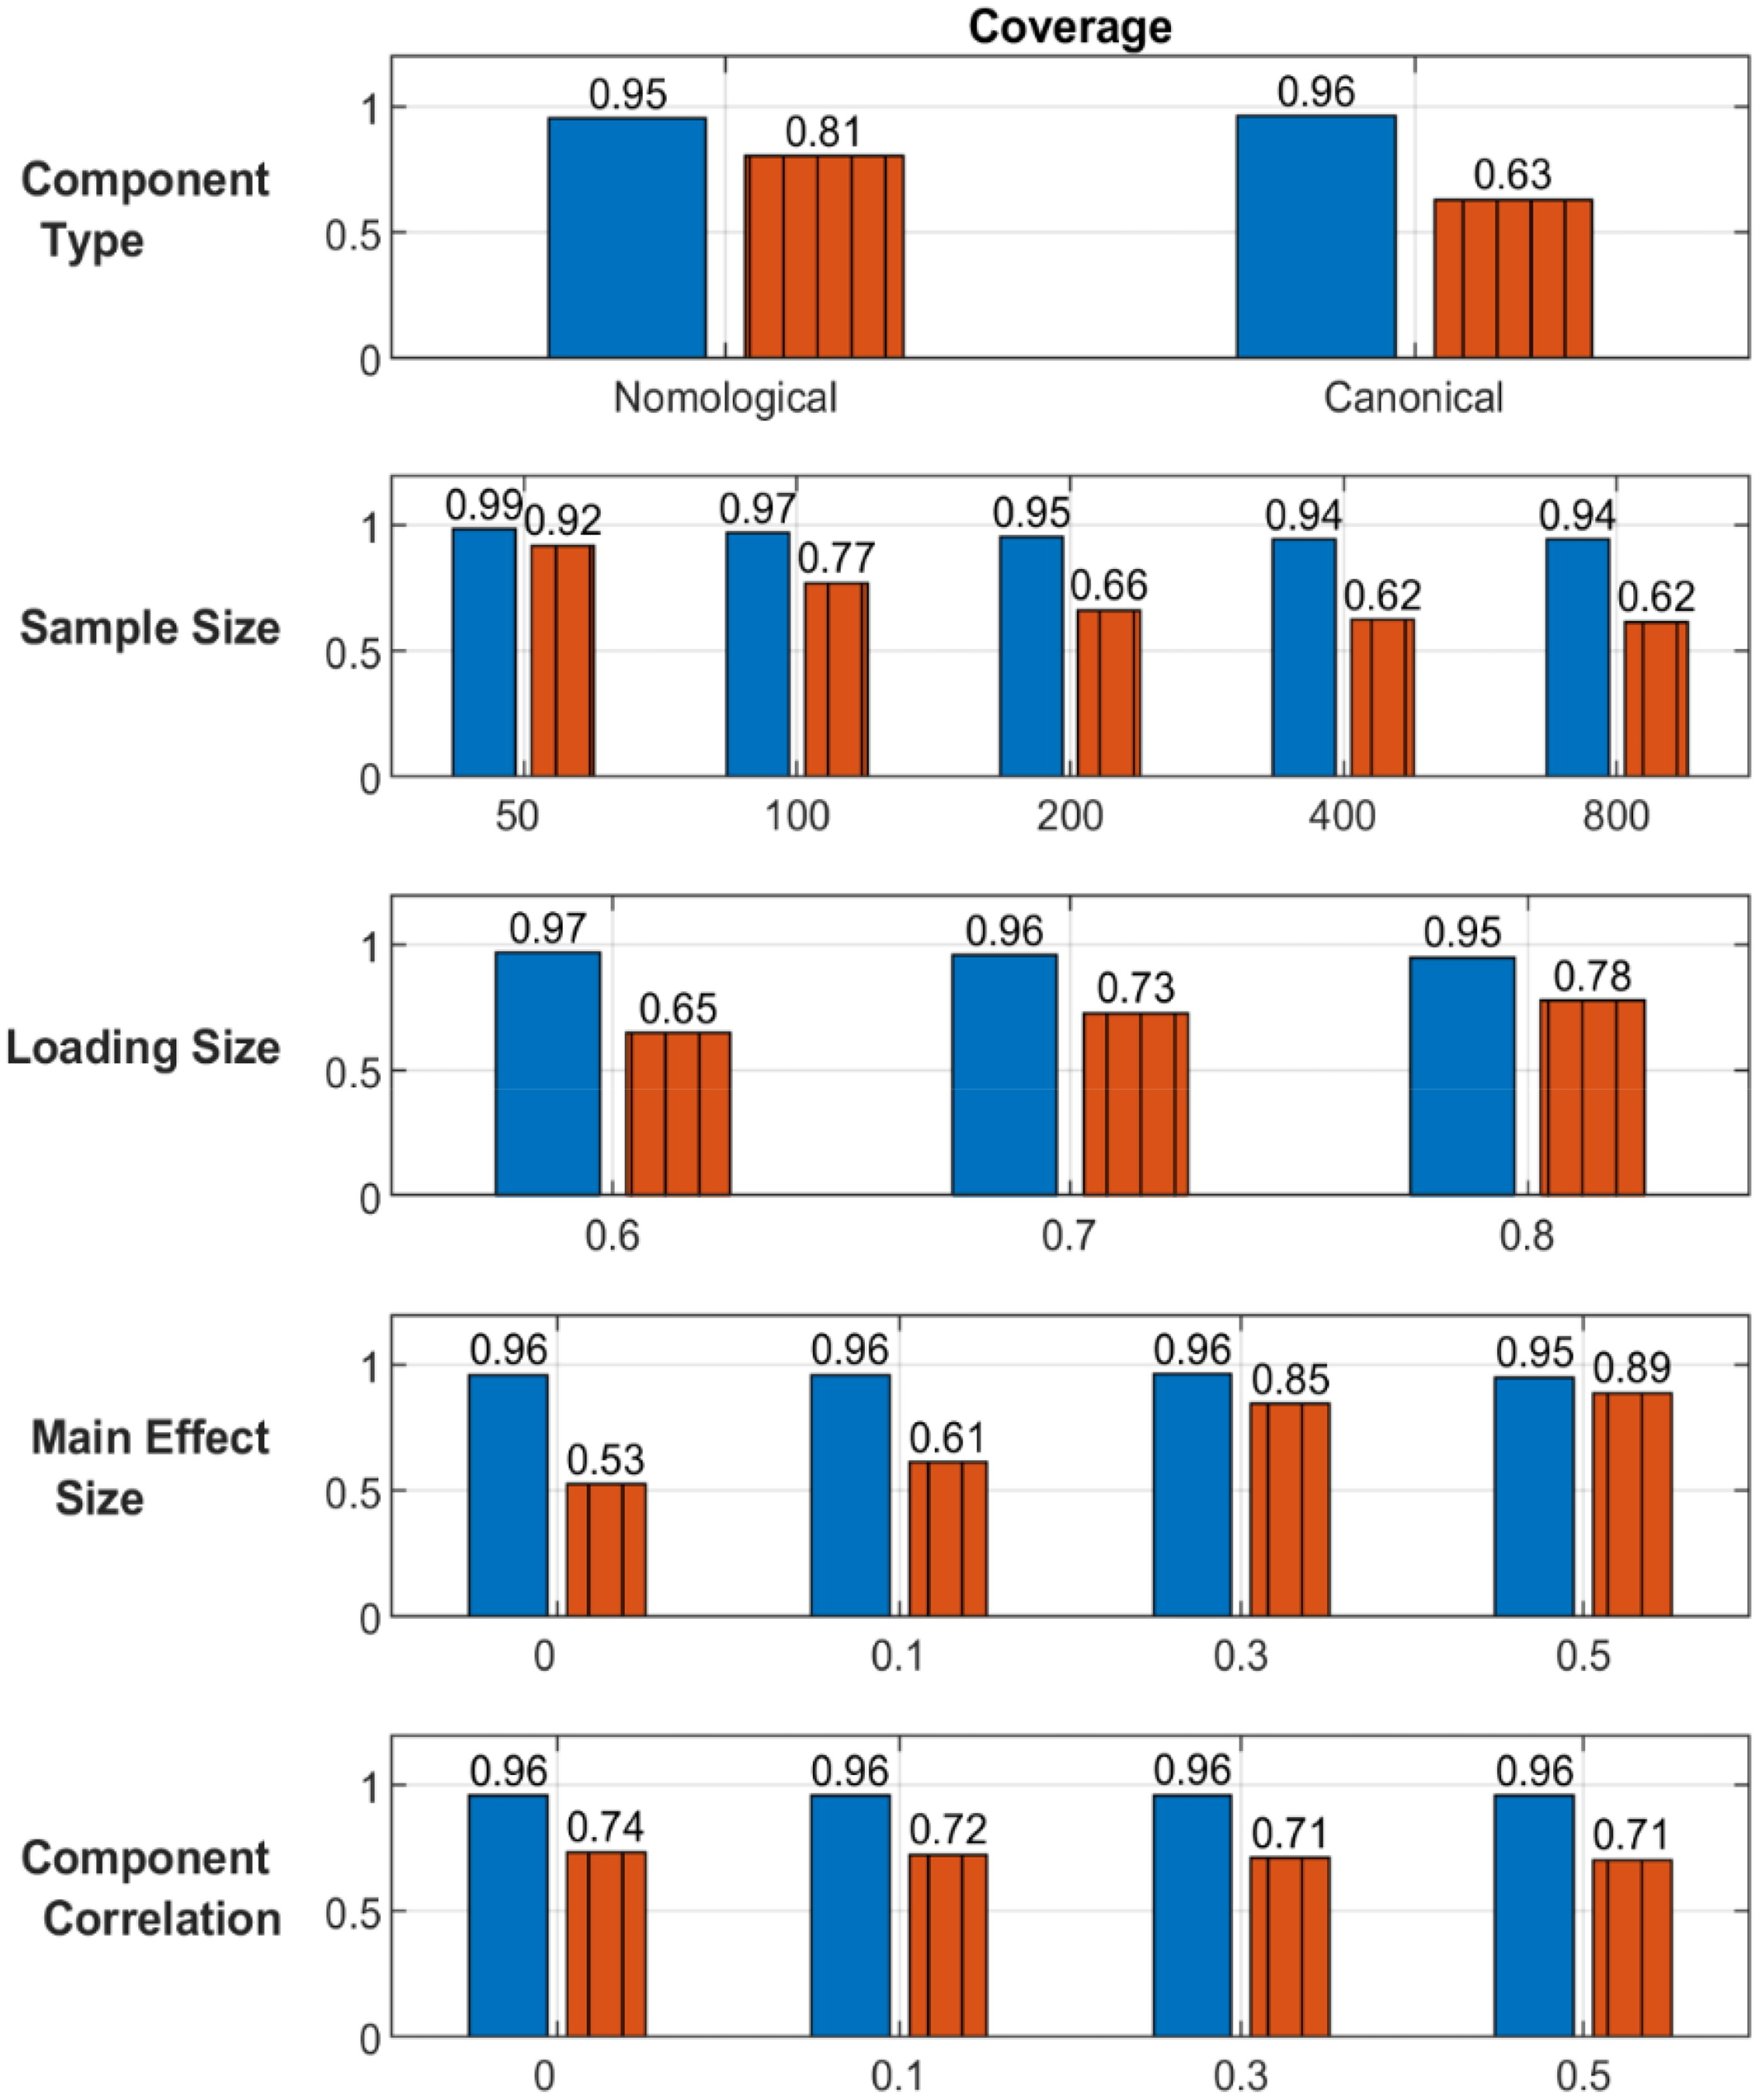
Caption & source
The coverage rates of the 95% confidence intervals for the interaction effect estimates from GSCA’s and PLSPM’s approaches in each condition. Blue solid and red vertical-line bars denote GSCA’s and PLSPM’s approaches, respectively.
Version of record · Figure source · CC BY-NC-ND 4.0
Shen, Cho, and Hwang (2025), Figure 7. Structural Equation Modeling: A Multidisciplinary Journal, 32(5), 753–765. https://doi.org/10.1080/10705511.2025.2497088. Reproduced without modification.
Versions & resources
Peer-reviewed journal article
Structural Equation Modeling: A Multidisciplinary Journal · 2025
DOI: 10.1080/10705511.2025.2497088Cite this work
Shen, Z., Cho, G., Hwang, H. (2025). Comparison of Component-Based Structural Equation Modeling Methods in Testing Component Interaction Effects. Structural Equation Modeling: A Multidisciplinary Journal, 32(5), 753–765. https://doi.org/10.1080/10705511.2025.2497088