
2024 · Journal of Product Innovation Management · 41(6), 1100–1117
Journal DOI: 10.1111/jpim.12738 Open access
Abstract
Scientific research demands robust findings, yet variability in results persists due to researchers' decisions in data analysis. Despite strict adherence to state‐of the‐art methodological norms, research results can vary when analyzing the same data. This article aims to explore this variability by examining the impact of researchers' analytical decisions when using different approaches to structural equation modeling (SEM), a widely used method in innovation management to estimate cause–effect relationships between constructs and their indicator variables. For this purpose, we invited SEM experts to estimate a model on absorptive capacity's impact on organizational innovation and performance using different SEM estimators. The results show considerable variability in effect sizes and significance levels, depending on the researchers' analytical choices. Our research underscores the necessity of transparent analytical decisions, urging researchers to acknowledge their results' uncertainty, to implement robustness checks, and to document the results from different analytical workflows. Based on our findings, we provide recommendations and guidelines on how to address results variability. Our findings, conclusions, and recommendations aim to enhance research validity and reproducibility in innovation management, providing actionable and valuable insights for improved future research practices that lead to solid practical recommendations.
Version of record · Abstract source · CC BY 4.0
Figures 5 images
Select an image to view it at full size. Captions identify the source and version.
Figure 1
Caption & source
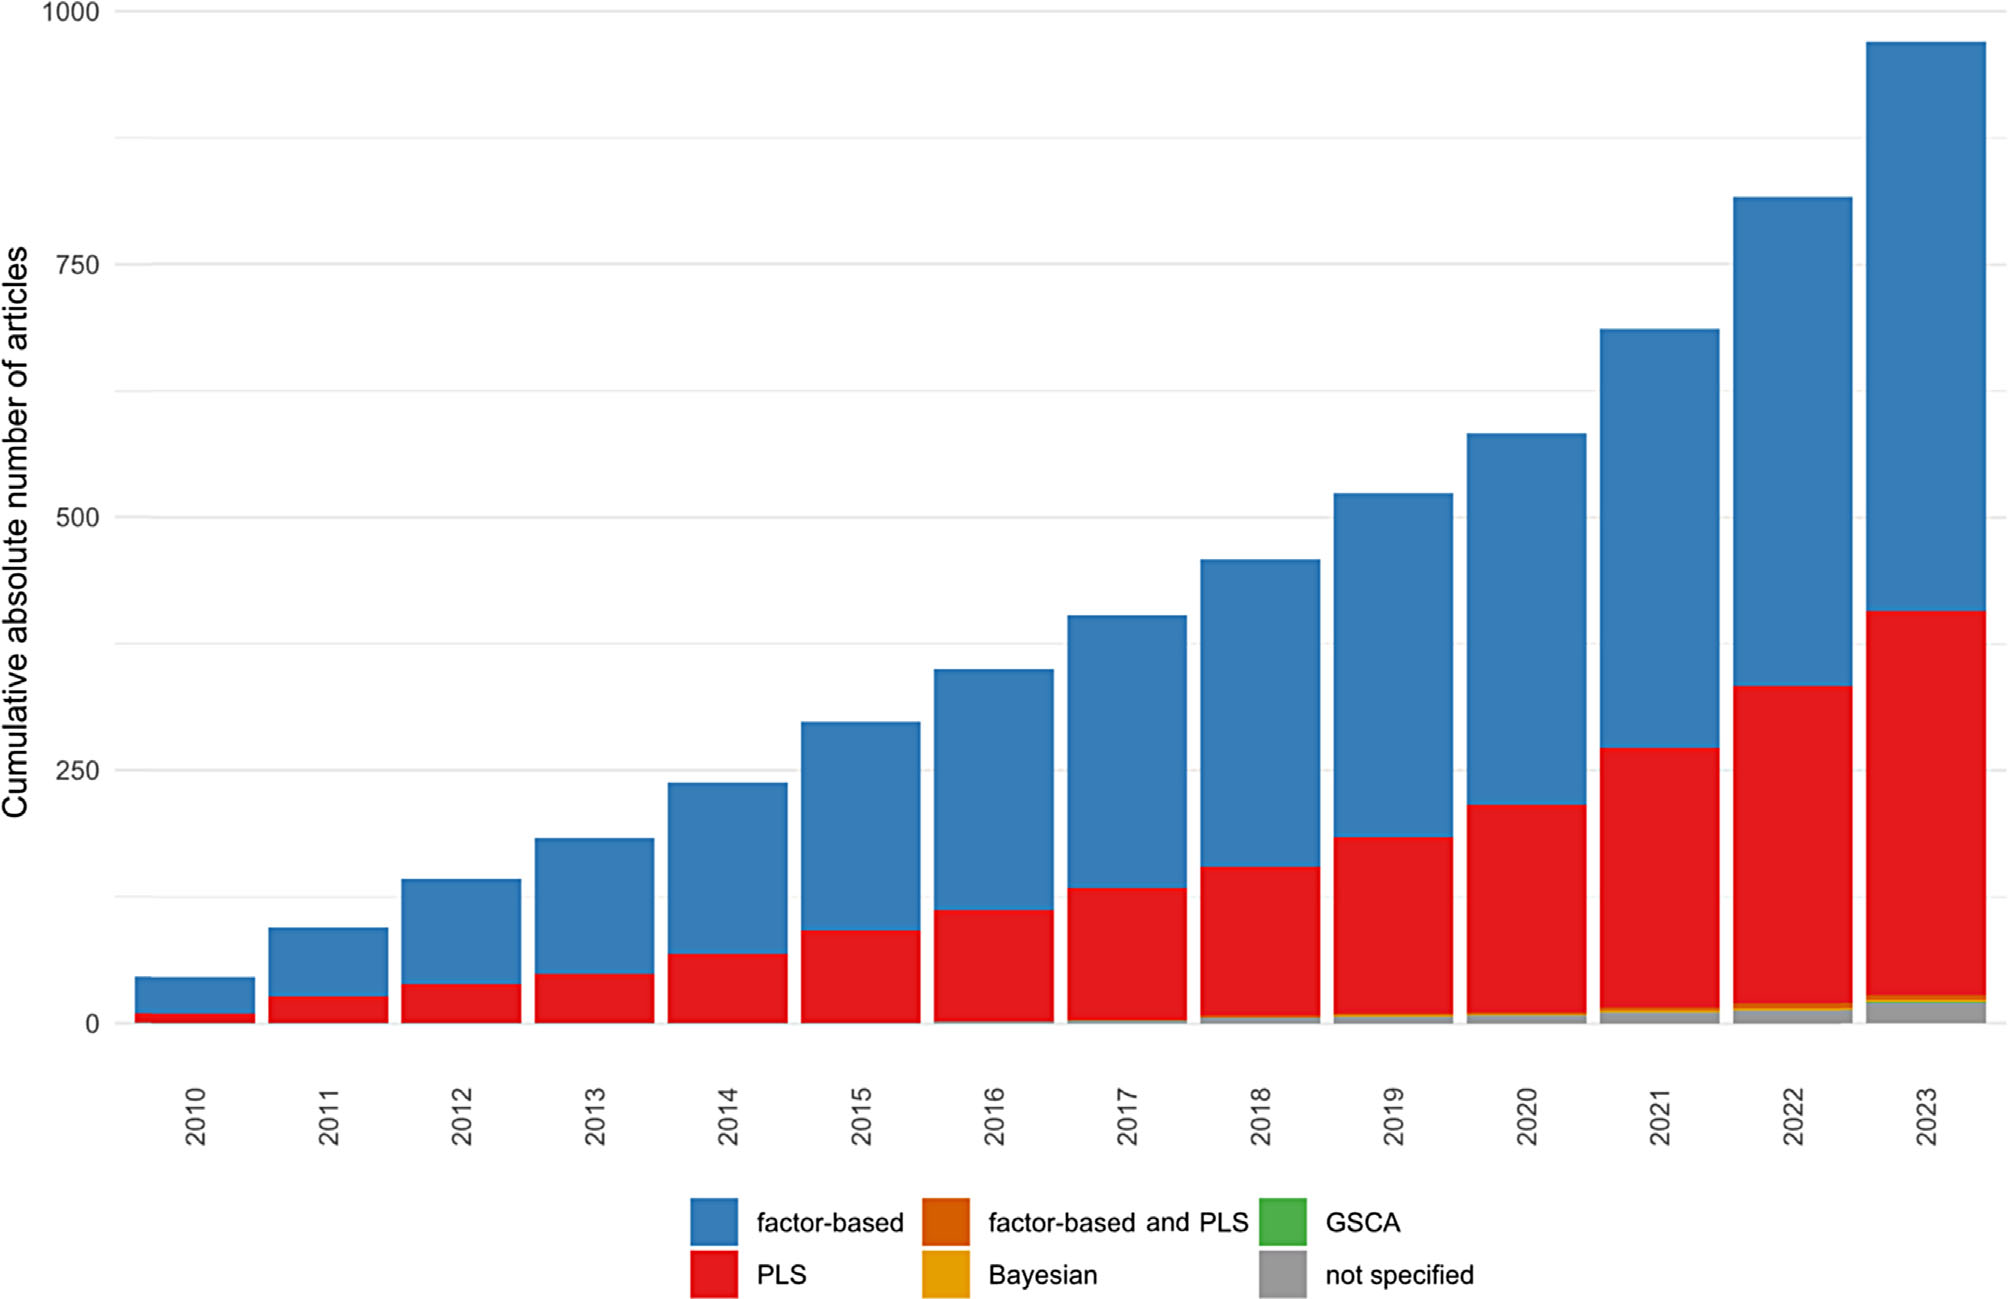
Cumulative number of articles using SEM per year and SEM type.
Version of record; original embedded figure extracted from the LMU repository PDF · Figure source · CC BY 4.0
Figure 2
Caption & source
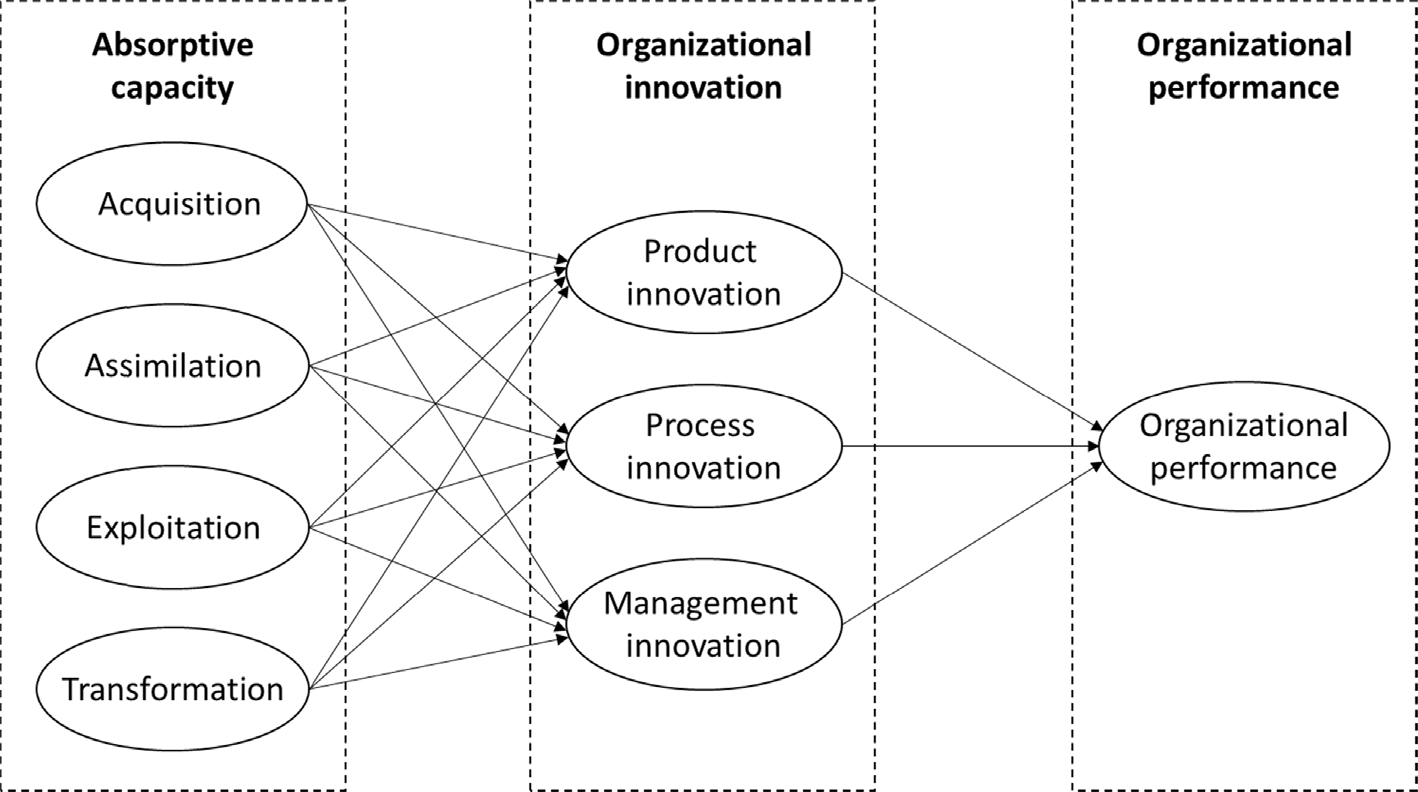
Research model (adapted from Ali et al., 2016).
Version of record; original embedded figure extracted from the LMU repository PDF · Figure source · CC BY 4.0
Figure 3
Caption & source
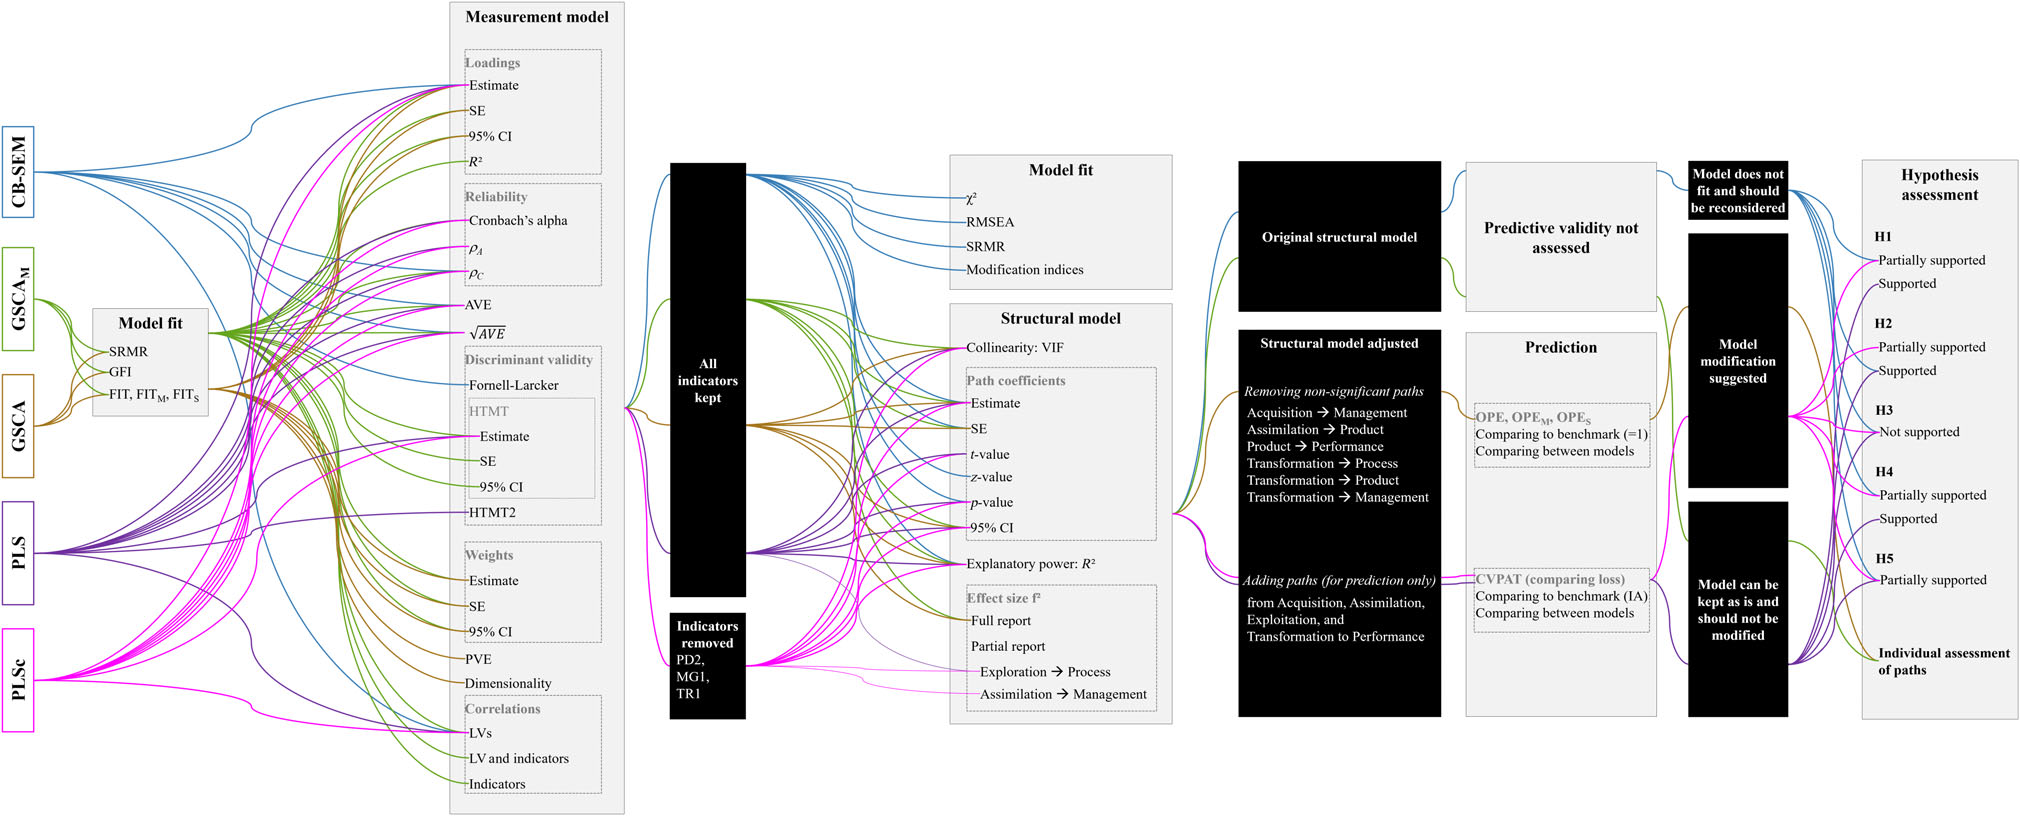
Workflow overview.
Version of record; original embedded figure extracted from the LMU repository PDF · Figure source · CC BY 4.0
Figure 4
Caption & source
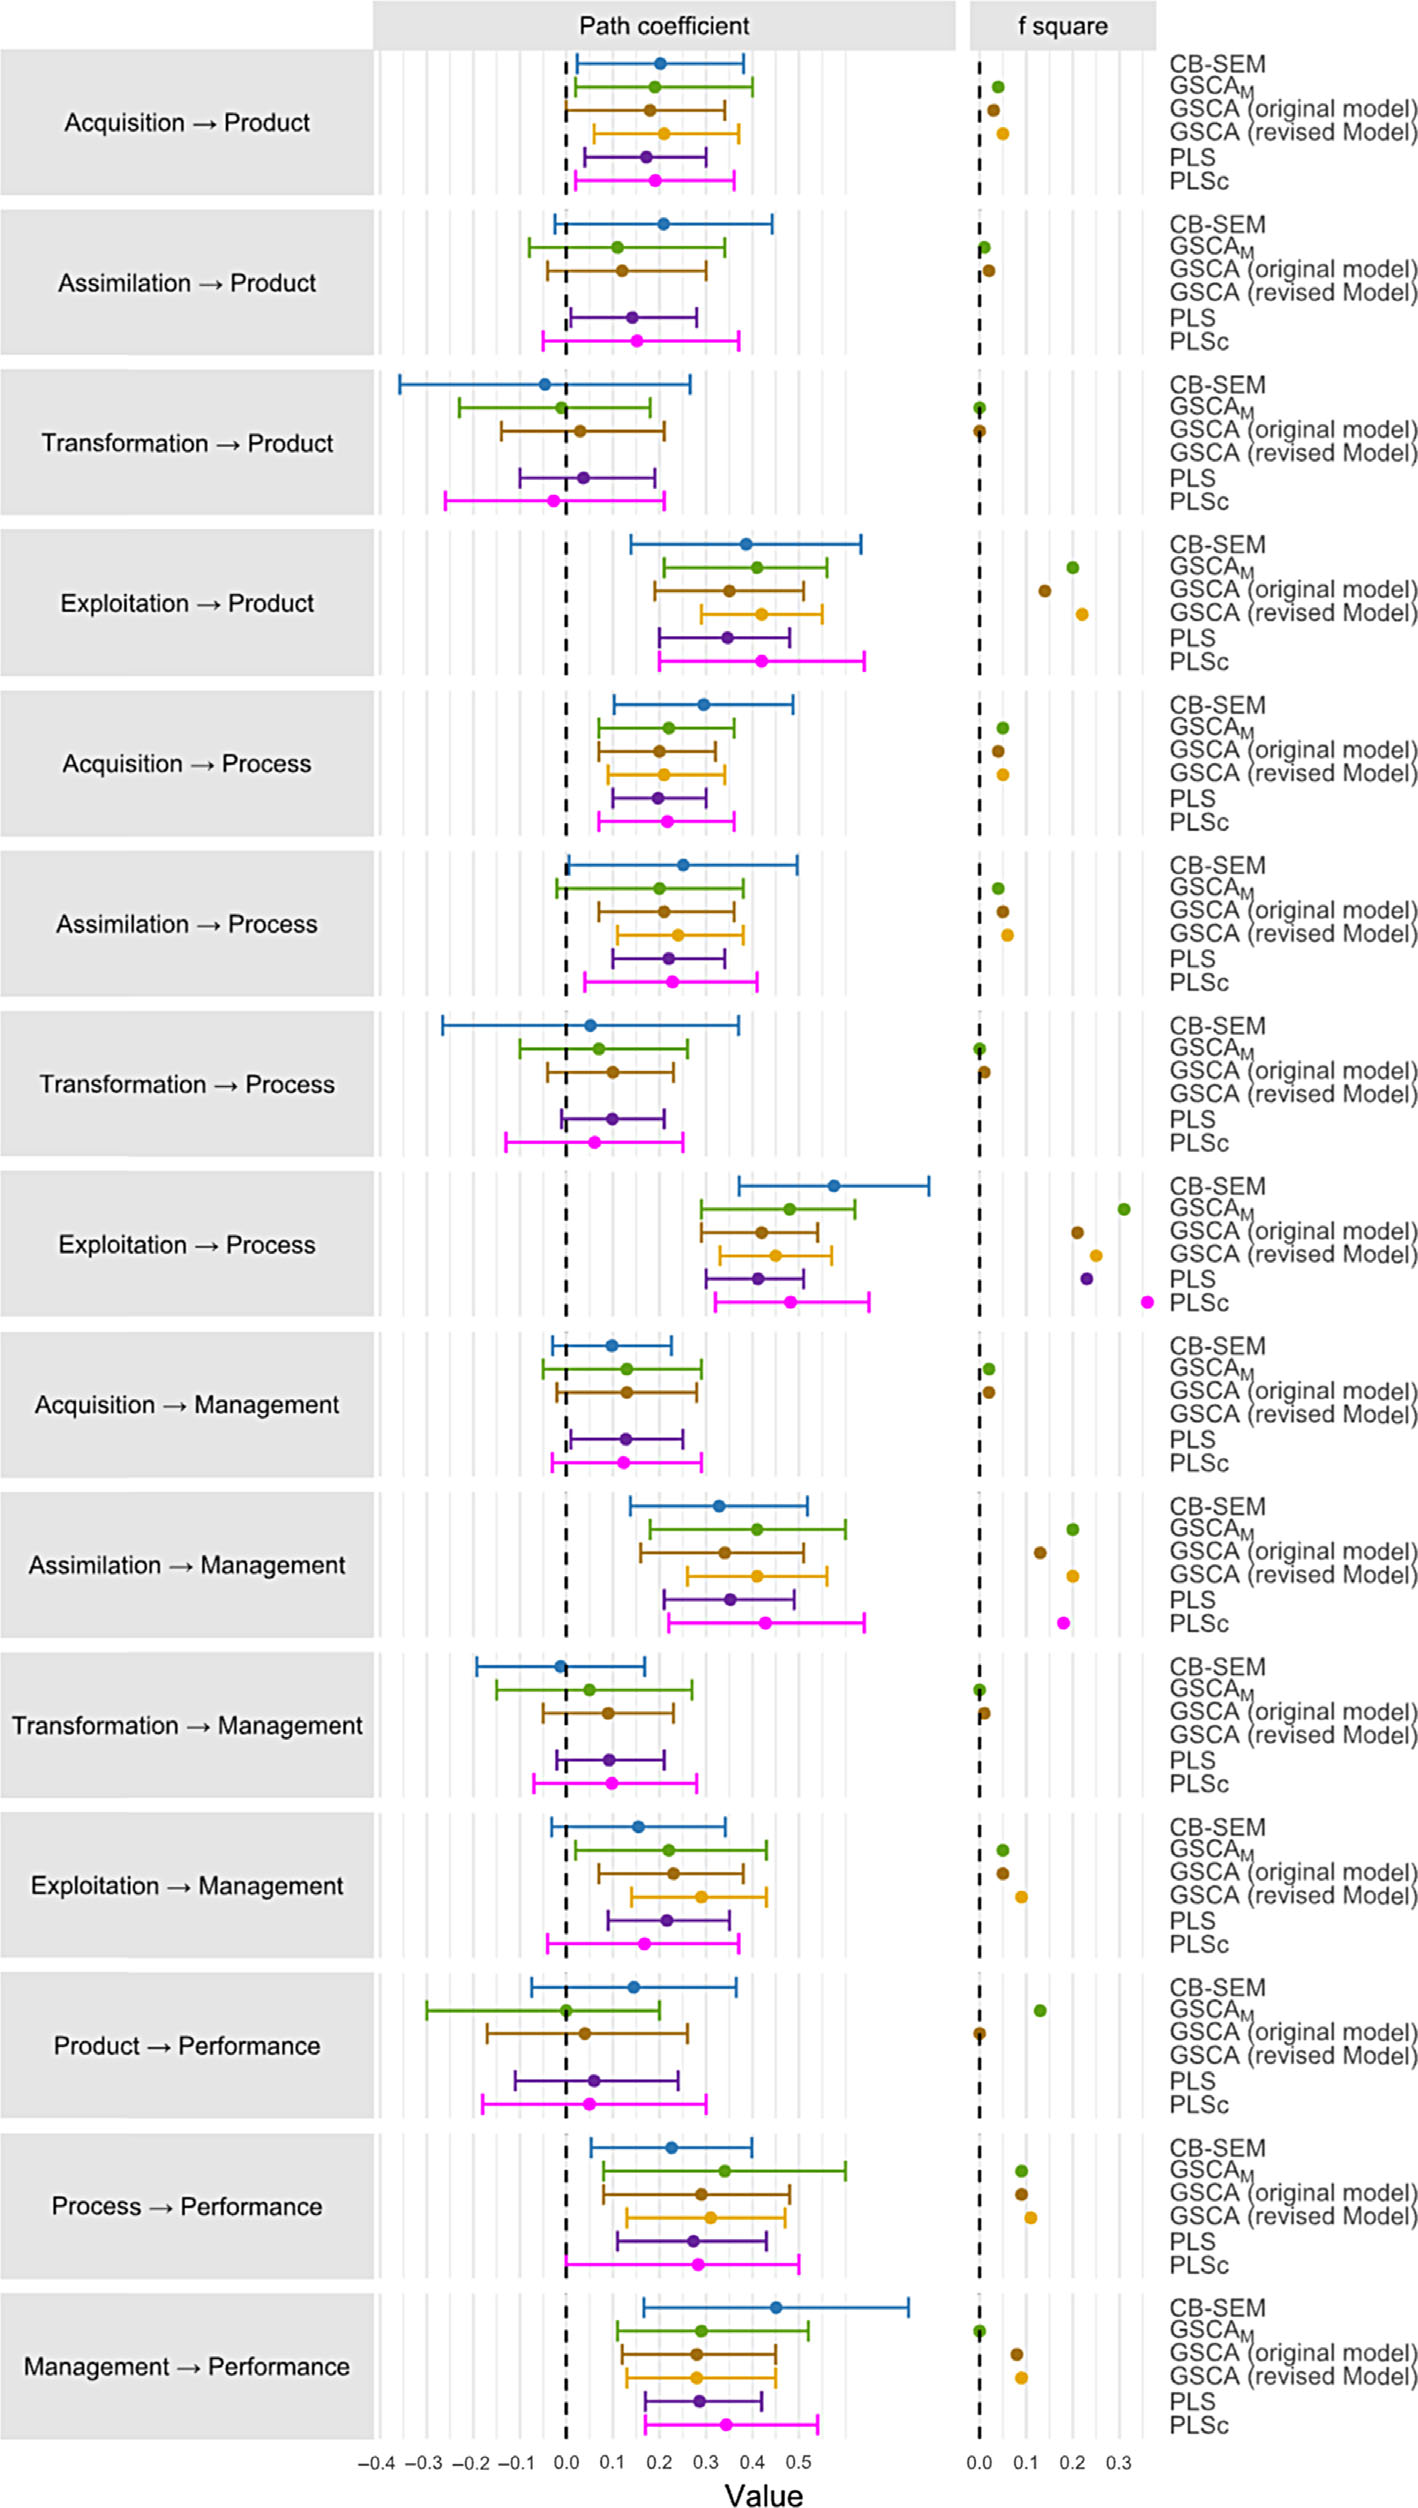
Structural model results across different methods. The bars represent 95% confidence intervals as reported in the articles. GSCA (original model) refers to the results from the original model specification, while GSCA (revised model) refers to the results after eliminating previously nonsignificant paths.
Version of record; original embedded figure extracted from the LMU repository PDF · Figure source · CC BY 4.0
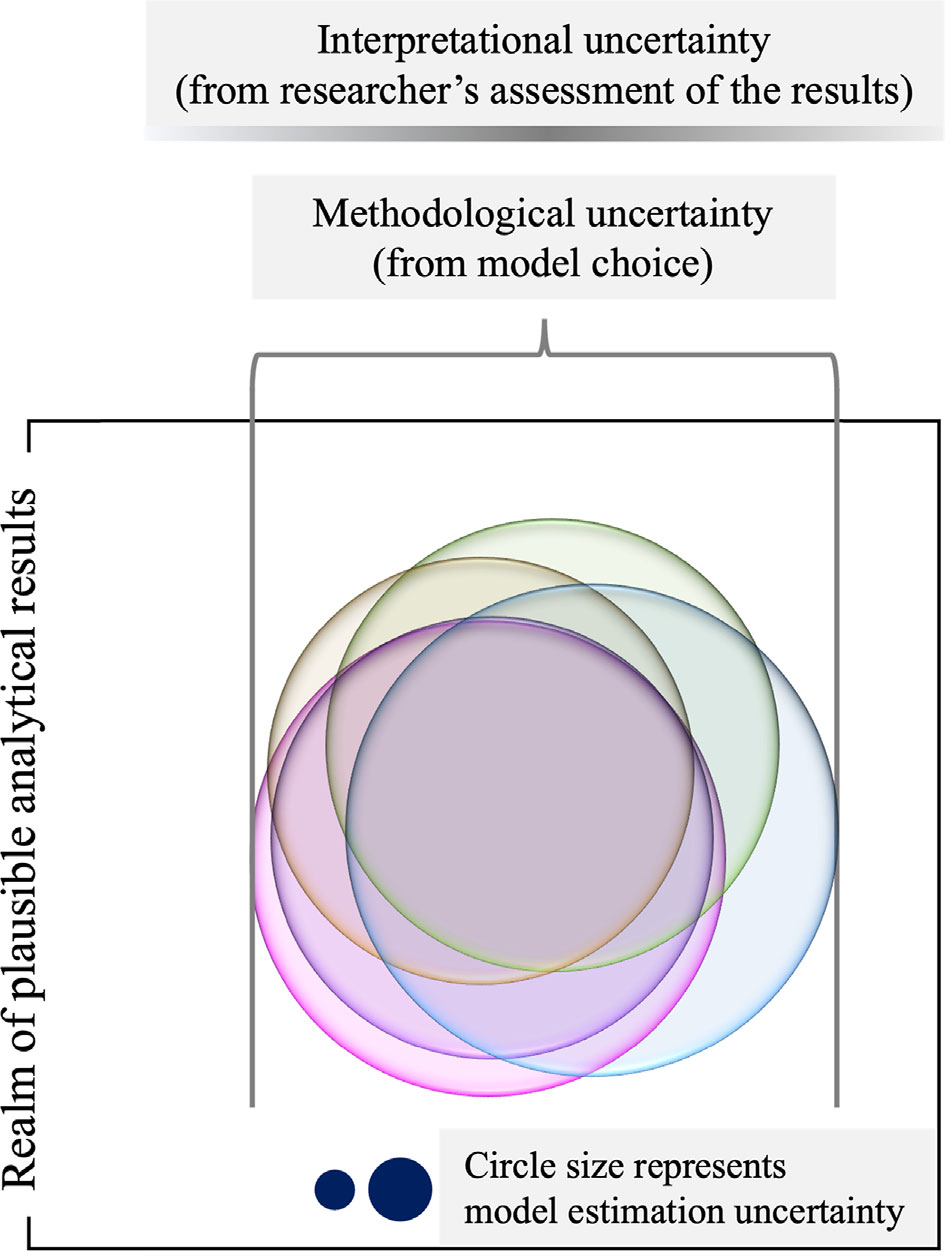
Figure 5
Caption & source
Schematic representation of three kinds of uncertainty.
Version of record; original embedded figure extracted from the LMU repository PDF · Figure source · CC BY 4.0
Versions & resources
Peer-reviewed journal article
Journal of Product Innovation Management · 2024
DOI: 10.1111/jpim.12738Cite this work
Sarstedt, M., Adler, S., Ringle, C. M., Cho, G., Diamantopoulos, A., Hwang, H., Liengaard, B. (2024). Same model, same data, but different outcomes: Evaluating the impact of method choices in structural equation modeling. Journal of Product Innovation Management, 41(6), 1100–1117. https://doi.org/10.1111/jpim.12738